Skip to content

GitHub Actions for Serverless Framework Deployments

This article was written over 18 months ago and may contain information that is out of date. Some content may be relevant but please refer to the relevant official documentation or available resources for the latest information.

Background

Our team was building a Serverless Framework API for a client that wanted to use the Serverless Dashboard for deployment and monitoring. Based on some challenges from last year, we agreed with the client that using a monorepo tool like Nx would be beneficial moving forward as we were potentially shipping multiple Serverless APIs and frontend applications. Unfortunately, we discovered several challenges integrating with the Serverless Dashboard, and eventually opted into custom CI/CD with GitHub Actions. We’ll cover the challenges we faced, and the solution we created to mitigate our problems and generate a solution.

Serverless Configuration Restrictions

By default, the Serverless Framework does all its configuration via a serverless.yml file. However, the framework officially supports alternative formats including .json, .js, and .ts.

Our team opted into the TypeScript format as we wanted to setup some validation for our engineers that were newer to the framework through type checks. When we eventually went to configure our CI/CD via the Serverless Dashboard UI, the dashboard itself restricted the file format to just the YAML format. This was unfortunate, but we were able to quickly revert back to YAML as configuration was relatively simple, and we were able to bypass this hurdle.

serverless-dashboard-setup

Prohibitive Project Structures

With our configuration now working, we were able to select the project, and launch our first attempt at deploying the app through the dashboard. Immediately, we ran into a build issue:

Build step: serverless deploy --stage dev --region us-west-1 --force --org my-org --app my-app --verbose 
Environment: linux, node 14.19.2, framework 3.21.0 (local), plugin 6.2.2, SDK 4.3.2
Docs:        docs.serverless.com
Support:     forum.serverless.com
Bugs:        github.com/serverless/serverless/issues
Error:
Serverless plugin "serverless-esbuild" not found. Make sure it's installed and listed in the "plugins" section of your serverless config file. Run "serverless plugin install -n serverless-esbuild" to install it.
Build step failed: serverless deploy --stage dev --region us-west-1 --force --org my-org --app my-app --verbose

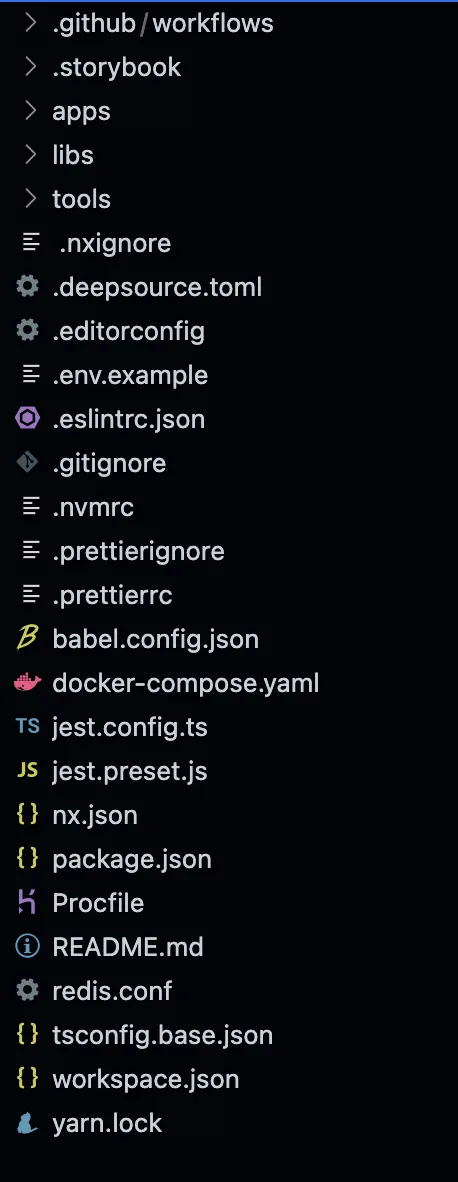
What we found was having our package.json in a parent directory of our serverless app prevented the dashboard CI/CD from being able to appropriately detect and resolve dependencies prior to deployment. We had been deploying using an Nx command: npx nx run api:deploy --stage=dev which was able to resolve our dependency tree which looked like:

serverless-nx-file-tree-snapshot

To resolve, we thought maybe we could customize the build commands utilized by the dashboard. Unfortunately, the only way to customize these commands is via the package.json of our project. Nx allows for package.json per app in their structure, but it defeated the purpose of us opting into Nx and made leveraging the tool nearly obsolete.

Moving to GitHub Actions with the Serverless Dashboard

We thought to move all of our CI/CD to GitHub Actions while still proxying the dashboard for deployment credentials and monitoring. In the dashboard docs, we found that you could set a SERVERLESS_ACCESS_KEY and still deploy through the dashboard. It took us a few attempts to understand exactly how to specify this key in our action code, but eventually, we discovered that it had to be set explicitly in the .env file due to the usage of the Nx build system to deploy. Thus the following actions were born:

api-ci.yml

name: API Linting, Testing, and Deployment

on:
  push:
    branches: [main]
  pull_request:
  workflow_dispatch:

jobs:
  api-deploy:
    runs-on: ubuntu-latest
    strategy:
      matrix:
        node-version: [14.x]
    steps:
      - name: Checkout Repo
        uses: actions/checkout@v3

      - name: Configure Node
        uses: actions/setup-node@v3
        with:
          node-version: '14.x'
          cache: 'yarn'

      - name: Install packages
        run: yarn install --frozen-lockfile

      - name: Create .env file for testing
        run: |
          cp .env.example .env.test

      - name: Run tests
        run: npx nx run api:test

      - name: Create .env file for deployment
        run: |
          touch .env
          echo SERVERLESS_ACCESS_KEY=${{ secrets.SERVERLESS_ACCESS_KEY }} >> .env
          cat .env

      - name: Deploy SLS Preview
        if: github.ref != 'refs/heads/main'
        run: npx nx run api:deploy --stage=${GITHUB_HEAD_REF}
      - name: Deploy SLS Dev
        if: github.ref == 'refs/heads/main'
        run: npx nx run api:deploy --stage=dev

api-clean.yml

name: API Clean Up

# When pull requests are closed the associated
# branch will be removed from SLS deploy
on:
  pull_request:
    types: [closed]

jobs:
  tear-down:
    runs-on: ubuntu-latest
    strategy:
      matrix:
        node-version: [14.x]
    steps:
      - name: Checkout Repo
        uses: actions/checkout@v3

      - name: Configure Node
        uses: actions/setup-node@v3
        with:
          node-version: '14.x'
          cache: 'yarn'

      - name: Install packages
        run: yarn install --frozen-lockfile

      - name: Create .env file for teardown
        run: |
          touch .env
          echo SERVERLESS_ACCESS_KEY=${{ secrets.SERVERLESS_ACCESS_KEY }} >> .env
          cat .env
      - name: Deploy SLS
        run: npx nx run api:teardown --stage=${GITHUB_HEAD_REF}

These actions ran smoothly and allowed us to leverage the dashboard appropriately. All in all this seemed like a success.

Local Development Problems

The above is a great solution if your team is willing to pay for everyone to have a seat on the dashboard. Unfortunately, our client wanted to avoid the cost of additional seats because the pricing was too high. Why is this a problem? Our configuration looks similar to this (I’ve highlighted the important lines with a comment):

serverless.ts

import type { Serverless } from 'serverless/aws';

const serverlessConfiguration: Serverless = {
  service: 'our-service',
  app: 'our-app', // NOTE THIS
  org: 'our-org', // NOTE THIS
  frameworkVersion: '3',
  useDotenv: true,
  plugins: [...],
  custom: { ... },
  package: { ... },
  provider: {
    name: 'aws',
    runtime: 'nodejs14.x',
    stage: "${opt:stage, 'dev'}",
    region: "${opt:region, 'us-east-1'}",
    memorySize: 512,
    timeout: 29,
    httpApi: { cors: true },
    environment: {
      REGION: '${aws:region}',
      SLS_STAGE: '${sls:stage}',
      SOME_SECRET: '${param:SOME_SECRET, env:SOME_SECRET}', // NOTE THIS
    },
  },
  functions: {
    graphql: {
      handler: 'src/handlers/graphql.server',
      events: [
        {
          httpApi: {
            method: 'post',
            path: '/graphql',
          },
        },
        {
          httpApi: {
            method: 'get',
            path: '/graphql',
          },
        },
      ],
    },
  },
};

module.exports = serverlessConfiguration;

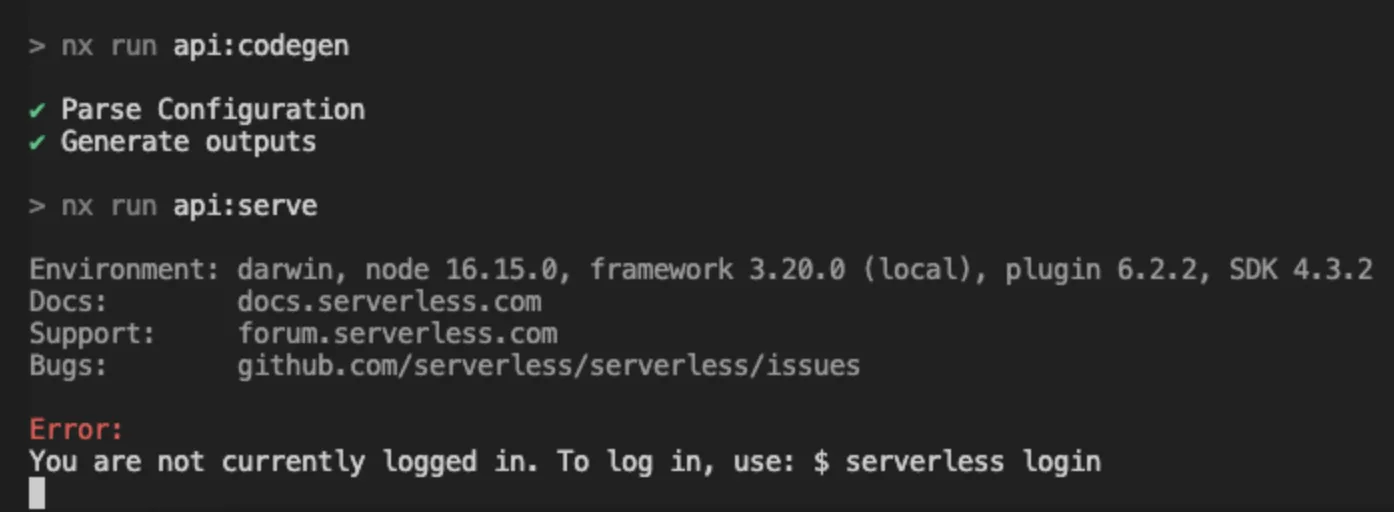
The app and org variables make it so it is required to have a valid dashboard login. This meant our developers working on the API problems couldn’t do local development because the client was not paying for the dashboard logins. They would get the following error:

serverless-deploy-output-warning

Resulting Configuration

At this point, we had to opt to bypass the dashboard entirely via CI/CD. We had to make the following changes to our actions and configuration to get everything 100% working:

serverless.ts

  • Remove app and org fields
  • Remove accessing environment secrets via the param option
import type { Serverless } from 'serverless/aws';

const serverlessConfiguration: Serverless = {
  service: 'our-service',
  frameworkVersion: '3',
  useDotenv: true,
  plugins: [...],
  custom: { ... },
  package: { ... },
  provider: {
    name: 'aws',
    runtime: 'nodejs14.x',
    stage: "${opt:stage, 'dev'}",
    region: "${opt:region, 'us-east-1'}",
    memorySize: 512, // default: 1024MB
    timeout: 29,
    httpApi: { cors: true },
    environment: {
      REGION: '${aws:region}',
      SLS_STAGE: '${sls:stage}',
      SOME_SECRET: '${env:SOME_SECRET}',
    },
  },
  functions: {
    graphql: {
      handler: 'src/handlers/graphql.server',
      events: [
        {
          httpApi: {
            method: 'post',
            path: '/graphql',
          },
        },
        {
          httpApi: {
            method: 'get',
            path: '/graphql',
          },
        },
      ],
    },
  },
};

module.exports = serverlessConfiguration;

api-ci.yml

  • Add all our secrets to GitHub and include them in the scripts
  • Add serverless confg
name: API Linting, Testing, and Deployment

on:
  push:
    branches: [main]
  pull_request:
  workflow_dispatch:

jobs:
  api-deploy:
    runs-on: ubuntu-latest
    strategy:
      matrix:
        node-version: [14.x]
    steps:
      - name: Checkout Repo
        uses: actions/checkout@v3

      - name: Configure Node
        uses: actions/setup-node@v3
        with:
          node-version: '14.x'
          cache: 'yarn'

      - name: Install packages
        run: yarn install --frozen-lockfile

      - name: Create .env file for testing
        run: |
          cp .env.example .env.test

      - name: Run tests
        run: npx nx run api:test

      - name: Configure credentials
        run: |
          npx serverless config credentials --provider aws --key $AWS_ACCESS_KEY_ID --secret $AWS_SECRET_ACCESS_KEY
        env:
          AWS_ACCESS_KEY_ID: ${{ secrets.AWS_ACCESS_KEY_ID }}
          AWS_SECRET_ACCESS_KEY: ${{ secrets.AWS_SECRET_ACCESS_KEY }}

      - name: Create .env file for deployment
        run: |
          touch .env
          echo SOME_SECRET=${{ secrets.SOME_SECRET }} >> .env
          # other keys here
          cat .env

      - name: Deploy SLS Preview
        if: github.ref != 'refs/heads/main'
        run: npx nx run api:deploy --stage=${GITHUB_HEAD_REF}
      - name: Deploy SLS Dev
        if: github.ref == 'refs/heads/main'
        run: npx nx run api:deploy --stage=dev

api-cleanup.yml

  • Add serverless config
  • Remove secrets
name: API Clean Up

# When pull requests are closed, the associated
# branch will be removed from SLS deploy
on:
  pull_request:
    types: [closed]

jobs:
  tear-down:
    runs-on: ubuntu-latest
    strategy:
      matrix:
        node-version: [14.x]
    steps:
      - name: Checkout Repo
        uses: actions/checkout@v3

      - name: Configure Node
        uses: actions/setup-node@v3
        with:
          node-version: '14.x'
          cache: 'yarn'

      - name: Install packages
        run: yarn install --frozen-lockfile

      - name: Configure credentials
        run: |
          npx serverless config credentials --provider aws --key $AWS_ACCESS_KEY_ID --secret $AWS_SECRET_ACCESS_KEY
        env:
          AWS_ACCESS_KEY_ID: ${{ secrets.AWS_ACCESS_KEY_ID }}
          AWS_SECRET_ACCESS_KEY: ${{ secrets.AWS_SECRET_ACCESS_KEY }}

      - name: Create .env file for teardown
        run: |
          touch .env
          echo SERVERLESS_ACCESS_KEY=${{ secrets.SERVERLESS_ACCESS_KEY }} >> .env
          cat .env
      - name: Deploy SLS
        run: npx nx run api:teardown --stage=${GITHUB_HEAD_REF}

Conclusions

The Serverless Dashboard is a great product for monitoring and seamless deployment in simple applications, but it still has a ways to go to support different architectures and setups while being scalable for teams. I hope to see them make the following changes:

  • Add support for different configuration file types
  • Add better support custom deployment commands
  • Update the framework to not fail on login so local development works regardless of dashboard credentials

The Nx + GitHub actions setup was a bit unnatural as well with the reliance on the .env file existing, so we hope the above action code will help someone in the future. That being said, we’ve been working with this on the team and it’s been a very seamless and positive change as our developers can quickly reference their deploys and know how to interact with Lambda directly for debugging issues already.

This Dot is a consultancy dedicated to guiding companies through their modernization and digital transformation journeys. Specializing in replatforming, modernizing, and launching new initiatives, we stand out by taking true ownership of your engineering projects.

We love helping teams with projects that have missed their deadlines or helping keep your strategic digital initiatives on course. Check out our case studies and our clients that trust us with their engineering.

You might also like

How to Create a Bot That Sends Slack Messages Using Block Kit and GitHub Actions cover image

How to Create a Bot That Sends Slack Messages Using Block Kit and GitHub Actions

Have you ever wanted to get custom notifications in Slack about new interactions in your GitHub repository? If so, then you're in luck. With the help of GitHub actions and Slack's Block Kit, it is super easy to set up automated workflows that will send custom messages to your Slack channel of choice. In this article, I will guide you on how to set up the Slack bot and send automatic messages using GH actions. Create a Slack app Firstly, we need to create a new Slack application. Go to Slack's app page. If you haven't created an app before you should see: otherwise you might see a list of your existing apps: Let's click the Create an App button. Frpm a modal that shows up, choose From scratch option: In the next step, we can choose the app's name (eg. My Awesome Slack App) and pick a workspace that you want to use for testing the app. After the app is created successfully, we need to configure a couple of additional options. Firstly we need to configure the OAuth & Permissions section: In the Scopes section, we need to add a proper scope for our bot. Let's click Add an OAuth Scope in the Bot Token Scopes section, and select an incoming-webhook scope: Next, in OAuth Tokens for Your Workspace section, click Install to Workspace and choose a channel that you want messages to be posted to. Finally, let's go to Incoming Webhooks page, and activate the incoming hooks toggle (if it wasn't already activated). Copy the webhook URL (we will need it for our GitHub action). Create a Github Action Workflow In this section, we will focus on setting up the GitHub action workflow that will post messages on behalf of the app we've just created. You can use any of your existing repositories, or create a new one. Setting Up Secrets In your repository, go to Settings -> Secrets and variables -> Actions section and create a New Repository Secret. We will call the secret SLACK_WEBHOOK_URL and paste the url we've previously copied as a value. Create a workflow To actually send a message we can use slackapi/slack-github-action GitHub action. To get started, we need to create a workflow file in .github/workflows directory. Let's create .github/workflows/slack-message.yml file to your repository with the following content and commit the changes to main branch. ` In this workflow, we've created a job that uses slackapi/slack-github-action action and sends a basic message with an action run id. The important thing is that we need to set our webhook url as an env variable. This was the action can use it to send a message to the correct endpoint. We've configured the action so that it can be triggered manually. Let's trigger it by going to Actions -> Send Slack notification We can run the workflow manually in the top right corner. After running the workflow, we should see our first message in the Slack channel that we've configured earlier. Manually triggering the workflow to send a message is not very useful. However, we now have the basics to create more useful actions. Automatic message on pull request merge Let's create an action that will send a notification to Slack about a new contribution to our repository. We will use Slack's Block Kit to construct our message. Firstly, we need to modify our workflow so that instead of being manually triggered, it runs automatically when a pull requests to main branch is merged. This can be configured in the on section of the workflow file: ` Secondly, let's make sure that we only run the workflow when a pull request is merged and not eg. closed without merging. We can configure that by using if condition on the job: ` We've used a repository name (github.repository) as well as the user login that created a pull request (github.event.pull_request.user.login), but we could customize the message with as many information as we can find in the pull_request event. If you want to quickly edit and preview the message template, you can use the Slack's Block Kit Builder. Now we can create any PR, eg. add some changes to README.md, and after the PR is merged, we will get a Slack message like this. Summary As I have shown in this article, sending Slack messages automatically using GitHub actions is quite easy. If you want to check the real life example, visit the starter.dev project where we are using the slackapi/slack-github-action to get notifications about new contributions (send-slack-notification.yml) If you have any questions, you can always Tweet or DM me at @ktrz. I'm always happy to help!...

How to automatically deploy your full-stack JavaScript app with AWS CodePipeline cover image

How to automatically deploy your full-stack JavaScript app with AWS CodePipeline

How to automatically deploy your full-stack JavaScript app from an NX monorepo with AWS CodePipeline In our previous blog post (How to host a full-stack JavaScript app with AWS CloudFront and Elastic Beanstalk) we set up a horizontally scalable deployment for our full-stack javascript app. In this article, we would like to show you how to set up AWS CodePipeline to automatically deploy changes to the application. APP Structure Our application is a simple front-end with an API back-end set up in an NX monorepo. The production built API code is hosted in Elastic Beanstalk, while the front-end is stored in S3 and hosted through CloudFront. Whenever we are ready to make a new release, we want to be able to deploy the new API and front-end versions to the existing distribution. In this article, we will set up a CodePipeline to deploy changes to the main branch of our connected repository. CodePipeline CodeBuild and the buildspec file First and foremost, we should set up the build job that will run the deploy logic. For this, we are going to need to use CodeBuild. Let's go into our repository and set up a build-and-deploy.buildspec.yml file. We put this file under the tools/aws/ folder. ` This buildspec file does not do much so far, we are going to extend it. In the installation phase, it will run npm ci to install the dependencies and in the build phase, we are going to run the build command using the ENVIRONMENT_TARGET variable. This is useful, because if you have more environments, like development and staging you can have different configurations and builds for those and still use the same buildspec file. Let's go to the Codebuild page in our AWS console and create a build project. Add a descriptive name, such as your-appp-build-and-deploy. Please provide a meaningful description for your future self. For this example, we are going to restrict the number of concurrent builds to 1. The next step is to set up the source for this job, so we can keep the buildspec file in the repository and make sure this job uses the steps declared in the yaml file. We use an access token that allows us to connect to GitHub. Here you can read more on setting up a GitHub connection with an access token. You can also connect with Oauth, or use an entirely different Git provider. We set our provider to GitHub and provided the repository URL. We also set the Git clone depth to 1, because that makes checking out the repo faster. In the Environment section, we recommend using an AWS CodeBuild managed image. We use the Ubuntu Standard runtime with the aws/codebuild/standard:7.0 version. This version uses Node 18. We want to always use the latest image version for this runtime and as the Environment type we are good with Linux EC2. We don't need elevated privileges, because we won't build docker images, but we do want to create a new service role. In the Buildspec section select Use a buildspec file and give the path from your repository root as the Buildspec name. For our example, it is tools/aws/build-and-deploy.buildspec.yml. We leave the Batch configuration and the Artifacts sections as they are and in the Logs section we select how we want the logs to work. For this example, to reduce cost, we are going to use S3 logs and save the build logs in the aws-codebuild-build-logs bucket that we created for this purpose. We are finished, so let's create the build project. CodePipeline setup To set up automated deployment, we need to create a CodePipeline. Click on Create pipeline and give it a name. We also want a new service role to be created for this pipeline. Next, we should set up the source stage. As the source provider, we need to use GitHub (version2) and set up a connection. You can read about how to do it here. After the connection is set up, select your repository and the branch you want to deploy from. We also want to start the pipeline if the source code changes. For the sake of simplicity, we want to have the Output artefact format as CodePipeline default. At the Build stage, we select AWS CodeBuild as the build provider and let's select the build that we created above. Remember that we have the ENVIRONMENT_TARGET as a variable used in our build, so let's add it to this stage with the Plaintext value prod. This way the build will run the build:prod command from our package.json. As the Build type we want Single build. We can skip the deployment stage because we are going to set up deployment in our build job. Review our build pipeline and create it. After it is created, it will run for the first time. At this time it will not deploy anything but it should run successfully. Deployment prerequisites To be able to deploy to S3 and Elastic Beanstalk, we need our CodeBuild job to be able to interact with those services. When we created the build, we created a service role for it. In this example, the service role is codebuild-aws-test-build-and-deploy-service-role. Let's go to the IAM page in the console and open the Roles page. Search for our codebuild role and let's add permissions to it. Click the Add permissions button and select Attach policies. We need two AWS-managed policies to be added to this service role. The AdministratorAccess-AWSElasticBeanstalk will allow us to deploy the API and the AmazonS3FullAccess will allow us to deploy the front-end. The CloudFrontFullAccess will allow us to invalidate the caches so CloudFront will send the new front-end files after the deployment is ready. Deployment Upload the front-end to S3 Uploading the front-end should be pretty straightforward. We use an AWS CodeBuild managed image in our pipeline, therefore, we have access to the aws command. Let's update our buildspec file with the following changes: ` First, we upload the fresh front-end build to the S3 bucket, and then we invalidate the caches for the index.html file, so CloudFront will immediately serve the changes. If you have more static files in your app, you might need to invalidate caches for those as well. Before we push the above changes up, we need to update the environment variables in our CodePipeline. To do this open the pipeline and click on the Edit button. This will then enable us to edit the Build stage. Edit the build step by clicking on the edit button. On this screen, we add the new environment variables. For this example, it is aws-hosting-prod as Plaintext for the FRONT_END_BUCKET and E3FV1Q1P98H4EZ as Plaintext for the CLOUDFRONT_DISTRIBUTION_ID Now if we add changes to our index.html file, for example, change the button to HELLO 2, commit it and push it. It gets deployed. Deploying the API to Elastic Beanstalk We are going to need some environment variables passed down to the build pipeline to be able to deploy to different environments, like staging or prod. We gathered these below: - COMMIT_ID: #{SourceVariables.CommitId} - This will have the commit id from the checkout step. We include this, so we can always check what commit is deployed. - ELASTIC_BEANSTALK_APPLICATION_NAME: Test AWS App - This is the Elastic Beanstalk app which has your environment associated. - ELASTIC_BEANSTALK_ENVIRONMENT_NAME: TestAWSApp-prod - This is the Elastic Beanstalk environment you want to deploy to - API_VERSION_BUCKET: elasticbeanstalk-us-east-1-474671518642 - This is the S3 bucket that was created by Elastic Beanstalk With the above variables, we can make some new variables during the build time, so we can make sure that every API version is unique and gets deployed. We set this up in the install phase. ` The APP_VERSION variable is the version property from the package.json file. In a release process, the application's version is stored here. The API_VERSION variable will contain the APP_VERSION and as a suffix, we include the build number. We want to upload this API version by indicating the commit ID, so the API_ZIP_KEY will have this information. The APP_VERSION_DESCRIPTION will be the description of the deployed version in Elastic Beanstalk. Finally, we are going to update the buildspec file with the actual Elastic Beanstalk deployment steps. ` Let's make a change in the API, for example, the message sent back by the /api/hello endpoint and push up the changes. --- Now every time a change is merged to the main branch, it gets pushed to our production deployment. Using these guides, you can set up multiple environments, and you can configure separate CodePipeline instances to deploy from different branches. I hope this guide proved to be helpful to you....

The Dangers of ORMs and How to Avoid Them cover image

The Dangers of ORMs and How to Avoid Them

Background We recently engaged with a client reporting performance issues with their product. It was a legacy ASP .NET application using Entity Framework to connect to a Microsoft SQL Server database. As the title of this post and this information suggest, the misuse of this Object-Relational Mapping (ORM) tool led to these performance issues. Since our blog primarily focuses on JavaScript/TypeScript content, I will leverage TypeORM to share examples that communicate the issues we explored and their fixes, as they are common in most ORM tools. Our Example Data If you're unfamiliar with TypeORM I recommend reading their docs or our other posts on the subject. To give us a variety of data situations, we will leverage a classic e-commerce example using products, product variants, customers, orders, and order line items. Our data will be related as follows: The relationship between customers and products is one we care about, but it is optional as it could be derived from customer->order->order line item->product. The TypeORM entity code would look as follows: ` With this example set, let's explore some common misuse patterns and how to fix them. N + 1 Queries One of ORMs' superpowers is quick access to associated records. For example, we want to get a product and its variants. We have 2 options for writing this operation. The first is to join the table at query time, such as: ` Which resolves to a SQL statement like (mileage varies with the ORM you use): ` The other option is to query the product variants separately, such as: ` This example executes 2 queries. The join operation performs 1 round trip to the database at 200ms, whereas the two operations option performs 2 round trips at 100ms. Depending on the location of your database to your server, the round trip time will impact your decision here on which to use. In this example, the decision to join or not is relatively unimportant and you can implement caching to make this even faster. But let's imagine a different situation/query that we want to run. Let's say we want to fetch a set of orders for a customer and all their order items and the products associated with them. With our ORM, we may want to write the following: ` When written out like this and with our new knowledge of query times, we can see that we'll have the following performance: 100ms * 1 query for orders + 100ms * order items count + 100ms * order items' products count. In the best case, this only takes 100ms, but in the worst case, we're talking about seconds to process all the data. That's an O(1 + N + M) operation! We can eagerly fetch with joins or collection queries based on our entity keys, and our query performance becomes closer to 100ms for orders + 100ms for order line items join + 100ms for product join. In the worst case, we're looking at 300ms or O(1)! Normally, N+1 queries like this aren't so obvious as they're split into multiple helper functions. In other languages' ORMs, some accessors look like property lookups, e.g. order.orderItems. This can be achieved with TypeORM using their lazy loading feature (more below), but we don't recommend this behavior by default. Also, you need to be wary of whether your ORM can be utilized through a template/view that may be looping over entities and fetching related records. In general, if you see a record being looped over and are experiencing slowness, you should verify if you've prefetched the data to avoid N+1 operations, as they can be a major bottleneck for performance. Our above example can be optimized by doing the following: ` Here, we prefetch all the needed order items and products and then index them in a hash table/dictionary to look them up during our loops. This keeps our code with the same readability but improves the performance, as in-memory lookups are constant time and nearly instantaneous. For performance comparison, we'd need to compare it to doing the full operation in the database, but this removes the egregious N+1 operations. Eager v Lazy Loading Another ORM feature to be aware of is eager loading and lazy loading. This implementation varies greatly in different languages and ORMs, so please reference your tool's documentation to confirm its behavior. TypeORM's eager v lazy loading works as follows: - If eager loading is enabled for a field when you fetch a record, the relationship will automatically preload in memory. - If lazy loading is enabled, the relationship is not available by default, and you need to request it via a key accessor that executes a promise. - If neither is enabled, it defaults to the behavior ascribed above when we explained handling N+1 queries. Sometimes, you don't want these relationships to be preloaded as you don't use the data. This behavior should not be used unless you have a set of relations that are always loaded together. In our example, products likely will always need product variants loaded, so this is a safe eager load, but eager loading order items on orders wouldn't always be used and can be expensive. You also need to be aware of the nuances of your ORM. With our original problem, we had an operation that looked like product.productVariants.insert({ … }). If you read more on Entity Framework's handling of eager v lazy loading, you'll learn that in this example, the product variants for the product are loaded into memory first and then the insert into the database happens. Loading the product variants into memory is unnecessary. A product with 100s (if not 1000s) of variants can get especially expensive. This was the biggest offender in our client's code base, so flipping the query to include the ID in the insert operation and bypassing the relationship saved us _seconds_ in performance. Database Field Performance Issues Another issue in the project was loading records with certain data types in fields. Specifically, the text type. The text type can be used to store arbitrarily long strings like blog post content or JSON blobs in the absence of a JSON type. Most databases use a technique that stores text fields off rows, which requires a special file system lookup operation to fetch that data. This can make a typical database lookup that would take 100ms under normal conditions to take 200ms. If you combine this problem with some of the N+1 and eager loading problems we've mentioned, this can lead to seconds, if not minutes, of query slowdown. For these, you should consider not including the column by default as part of your ORM. TypeORM allows for this via their hidden columns feature. In this example, for our product description, we could change the definition to be: ` This would allow us to query products without descriptions quickly. If we needed to include the product description in an operation, we'd have to use the addSelect function to our query to include that data in our result like: ` This is an optimization you should be wary of making in existing systems but one worth considering to improve performance, especially for data reports. Alternatively, you could optimize a query using the select method to limit the fields returned to those you need. Database v. In-Memory Fetching Going back to one of our earlier examples, we wrote the following: ` This involves loading our data in memory and then using system memory to perform a group-by operation. Our database could have also returned this result grouped. We opted to perform this operation like this because it made fetching the order item IDs easier. This takes some performance challenges away from our database and puts the performance effort on our servers. Depending on your database and other system constraints, this is a trade-off, so do some benchmarking to confirm your best options here. This example is not too bad, but let's say we wanted to get all the orders for a customer with an item that cost more than $20. Your first inclination might be to use your ORM to fetch all the orders and their items and then filter that operation in memory using JavaScript's filter method. In this case, you're loading data you don't need into memory. This is a time to leverage the database more. We could write this query as follows in SQL: ` This just loads the orders that had the data that matched our condition. We could write this as: ` We constrained this to a single customer, but if it were for a set of customers, it could be significantly faster than loading all the data into memory. If our server has memory limitations, this is a good concern to be aware of when optimizing for performance. We noticed a few instances on our client's implementation where the filter operations were applied in functions that appeared to run the operation in the database but were running the operation in memory, so this was preloading more data into memory than needed on a memory-constrained server. Refer to your ORM manual to avoid this type of performance hit. Lack of Indexes The final issue we encountered was a lack of indexes on key lookups. Some ORMs do not support defining indexes in code and are manually applied to databases. These tend not to be documented, so an out-of-sync issue can happen in different environments. To avoid this challenge, we prefer ORMs that support indexes in code like TypeORM. In our last example, we filtered on the cost of an order item, but the cost field does not contain an index. This leads to a full table scan of our data collection filtered by the customer. The query cost can be very expensive if a customer has thousands of orders. Adding the index can make our query super fast, but it comes at a cost. Each new index makes writing to the database slower and can exponentially increase the size of our database needs. You should only add indexes to fields that you are querying against regularly. Again, be sure you can notate these indexes in code so they can be replicated across environments easily. In our client's system, the previous developer did not include indexes in the code, so we retroactively added the database indexes to the codebase. We recommend using your database's recommended tool for inspection to determine what indexes are in place and keep these systems in sync at all times. Conclusion ORMs can be an amazing tool to help you and your teams build applications quickly. However, they have gotchas for performance that you should be aware of and can identify while developing or during code reviews. These are some of the most common examples I could think of for best practices. When you hear the horror stories about ORMs, these are some of the challenges typically discussed. I'm sure there are more, though. What are some that you know? Let us know!...

Next.js + MongoDB Connection Storming cover image

Next.js + MongoDB Connection Storming

Building a Next.js application connected to MongoDB can feel like a match made in heaven. MongoDB stores all of its data as JSON objects, which don’t require transformation into JavaScript objects like relational SQL data does. However, when deploying your application to a serverless production environment such as Vercel, it is crucial to manage your database connections properly. If you encounter errors like these, you may be experiencing Connection Storming: * MongoServerSelectionError: connect ECONNREFUSED <IP_ADDRESS>:<PORT> * MongoNetworkError: failed to connect to server [<hostname>:<port>] on first connect * MongoTimeoutError: Server selection timed out after <x> ms * MongoTopologyClosedError: Topology is closed, please connect * Mongo Atlas: Connections % of configured limit has gone above 80 Connection storming occurs when your application has to mount a connection to Mongo for every serverless function or API endpoint call. Vercel executes your application’s code in a highly concurrent and isolated fashion. So, if you create new database connections on each request, your app might quickly exceed the connection limit of your database. We can leverage Vercel’s fluid compute model to keep our database connection objects warm across function invocations. Traditional serverless architecture was designed for quick, stateless web app transactions. Now, especially with the rise of LLM-oriented applications built with Next.js, interactions with applications are becoming more sequential. We just need to ensure that we assign our MongoDB connection to a global variable. Protip: Use global variables Vercel’s fluid compute model means all memory, including global constants like a MongoDB client, stays initialized between requests as long as the instance remains active. By assigning your MongoDB client to a global constant, you avoid redundant setup work and reduce the overhead of cold starts. This enables a more efficient approach to reusing connections for your application’s MongoDB client. The example below demonstrates how to retrieve an array of users from the users collection in MongoDB and either return them through an API request to /api/users or render them as an HTML list at the /users route. To support this, we initialize a global clientPromise variable that maintains the MongoDB connection across warm serverless executions, avoiding re-initialization on every request. ` Using this database connection in your API route code is easy: ` You can also use this database connection in your server-side rendered React components. ` In serverless environments like Vercel, managing database connections efficiently is key to avoiding connection storming. By reusing global variables and understanding the serverless execution model, you can ensure your Next.js app remains stable and performant....

Let's innovate together!

We're ready to be your trusted technical partners in your digital innovation journey.

Whether it's modernization or custom software solutions, our team of experts can guide you through best practices and how to build scalable, performant software that lasts.

Prefer email? hi@thisdot.co