Skip to content

How to automatically deploy your full-stack JavaScript app with AWS CodePipeline

How to automatically deploy your full-stack JavaScript app with AWS CodePipeline

How to host a full stack javascript app with AWS - 1 Part Series

How to automatically deploy your full-stack JavaScript app from an NX monorepo with AWS CodePipeline

In our previous blog post (How to host a full-stack JavaScript app with AWS CloudFront and Elastic Beanstalk) we set up a horizontally scalable deployment for our full-stack javascript app. In this article, we would like to show you how to set up AWS CodePipeline to automatically deploy changes to the application.

APP Structure

Our application is a simple front-end with an API back-end set up in an NX monorepo. The production built API code is hosted in Elastic Beanstalk, while the front-end is stored in S3 and hosted through CloudFront. Whenever we are ready to make a new release, we want to be able to deploy the new API and front-end versions to the existing distribution.

Architecture

In this article, we will set up a CodePipeline to deploy changes to the main branch of our connected repository.

CodePipeline

CodeBuild and the buildspec file

First and foremost, we should set up the build job that will run the deploy logic. For this, we are going to need to use CodeBuild. Let's go into our repository and set up a build-and-deploy.buildspec.yml file. We put this file under the tools/aws/ folder.

version: 0.2

phases:
  install:
    runtime-versions:
      nodejs: 18
    on-failure: ABORT
    commands:
      - npm ci
  build:
    on-failure: ABORT
    commands:
      # Build the front-end and the back-end
      - npm run build:$ENVIRONMENT_TARGET
      # TODO: Push FE to S3
      # TODO: Push API to Elastic beanstalk

This buildspec file does not do much so far, we are going to extend it. In the installation phase, it will run npm ci to install the dependencies and in the build phase, we are going to run the build command using the ENVIRONMENT_TARGET variable. This is useful, because if you have more environments, like development and staging you can have different configurations and builds for those and still use the same buildspec file.

Let's go to the Codebuild page in our AWS console and create a build project. Add a descriptive name, such as your-appp-build-and-deploy. Please provide a meaningful description for your future self. For this example, we are going to restrict the number of concurrent builds to 1.

Build project configuration

The next step is to set up the source for this job, so we can keep the buildspec file in the repository and make sure this job uses the steps declared in the yaml file. We use an access token that allows us to connect to GitHub. Here you can read more on setting up a GitHub connection with an access token. You can also connect with Oauth, or use an entirely different Git provider.

Source setup

We set our provider to GitHub and provided the repository URL. We also set the Git clone depth to 1, because that makes checking out the repo faster.

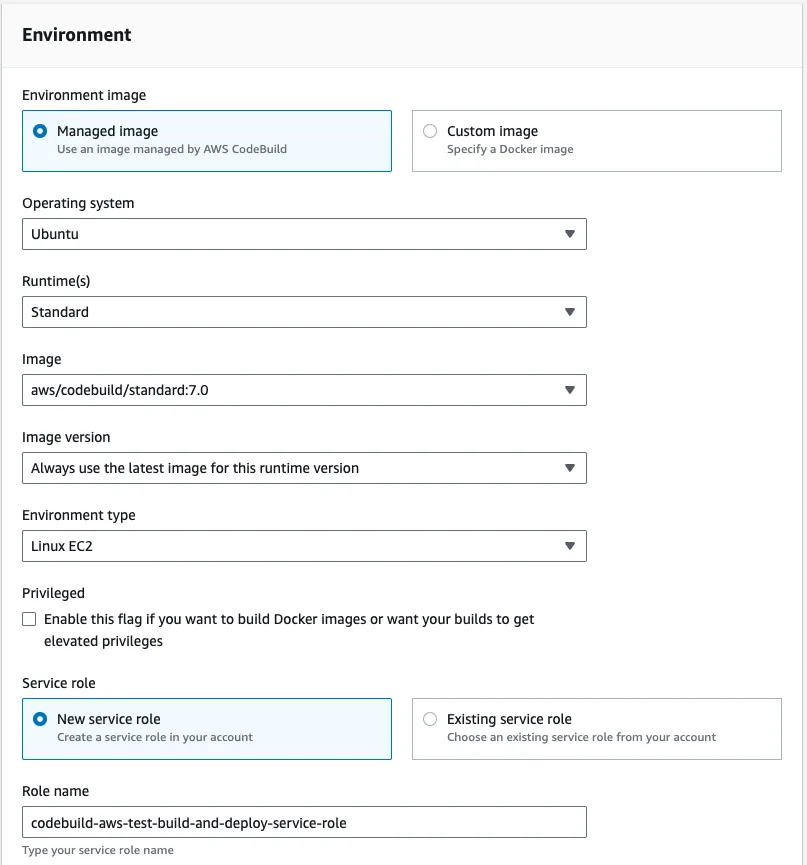
In the Environment section, we recommend using an AWS CodeBuild managed image. We use the Ubuntu Standard runtime with the aws/codebuild/standard:7.0 version. This version uses Node 18. We want to always use the latest image version for this runtime and as the Environment type we are good with Linux EC2. We don't need elevated privileges, because we won't build docker images, but we do want to create a new service role.

CodeBuild environment

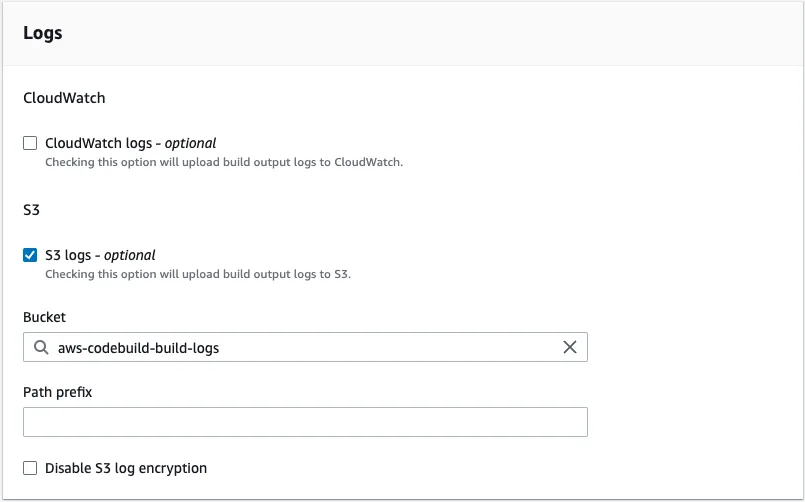
In the Buildspec section select Use a buildspec file and give the path from your repository root as the Buildspec name. For our example, it is tools/aws/build-and-deploy.buildspec.yml. We leave the Batch configuration and the Artifacts sections as they are and in the Logs section we select how we want the logs to work. For this example, to reduce cost, we are going to use S3 logs and save the build logs in the aws-codebuild-build-logs bucket that we created for this purpose. We are finished, so let's create the build project.

CodeBuild logs

CodePipeline setup

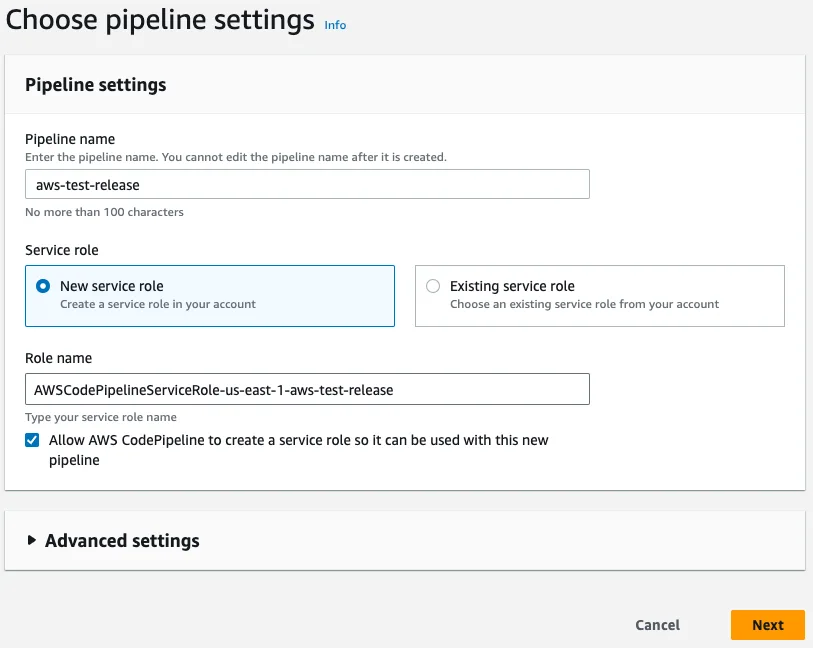
To set up automated deployment, we need to create a CodePipeline. Click on Create pipeline and give it a name. We also want a new service role to be created for this pipeline.

CodePipeline settings

Next, we should set up the source stage. As the source provider, we need to use GitHub (version2) and set up a connection. You can read about how to do it here. After the connection is set up, select your repository and the branch you want to deploy from. We also want to start the pipeline if the source code changes. For the sake of simplicity, we want to have the Output artefact format as CodePipeline default.

Pipeline source

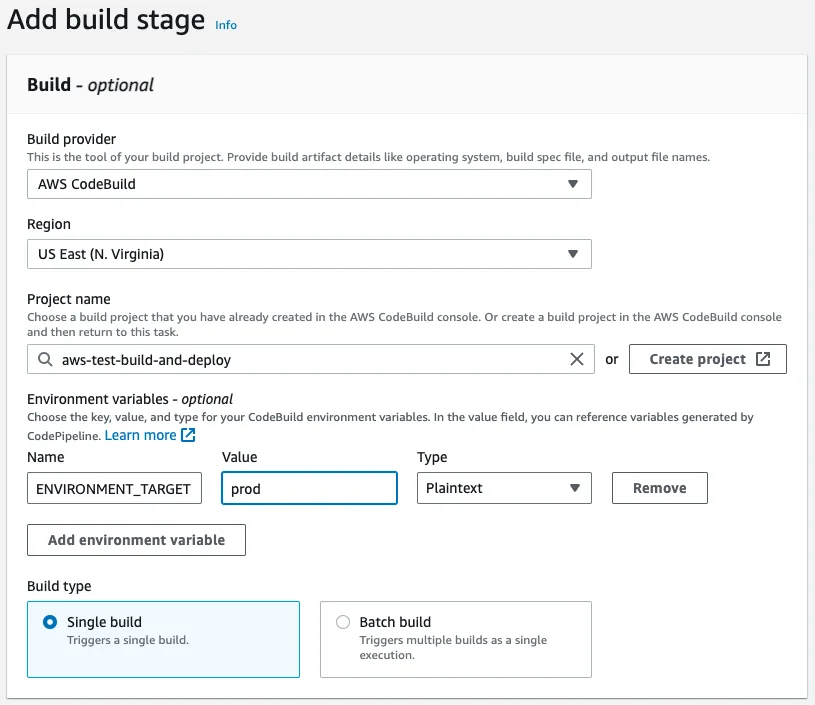
At the Build stage, we select AWS CodeBuild as the build provider and let's select the build that we created above. Remember that we have the ENVIRONMENT_TARGET as a variable used in our build, so let's add it to this stage with the Plaintext value prod. This way the build will run the build:prod command from our package.json. As the Build type we want Single build.

Pipeline build stage

We can skip the deployment stage because we are going to set up deployment in our build job. Review our build pipeline and create it. After it is created, it will run for the first time. At this time it will not deploy anything but it should run successfully.

Deployment prerequisites

To be able to deploy to S3 and Elastic Beanstalk, we need our CodeBuild job to be able to interact with those services. When we created the build, we created a service role for it. In this example, the service role is codebuild-aws-test-build-and-deploy-service-role. Let's go to the IAM page in the console and open the Roles page. Search for our codebuild role and let's add permissions to it. Click the Add permissions button and select Attach policies. We need two AWS-managed policies to be added to this service role. The AdministratorAccess-AWSElasticBeanstalk will allow us to deploy the API and the AmazonS3FullAccess will allow us to deploy the front-end. The CloudFrontFullAccess will allow us to invalidate the caches so CloudFront will send the new front-end files after the deployment is ready.

New policies

Deployment

Upload the front-end to S3

Uploading the front-end should be pretty straightforward. We use an AWS CodeBuild managed image in our pipeline, therefore, we have access to the aws command. Let's update our buildspec file with the following changes:

phases:
# ...
  build:
    on-failure: ABORT
    commands:
      # Build the front-end and the back-end
      - npm run build:$ENVIRONMENT_TARGET
      # Delete the current front-end and deploy the new version front-end
      - aws s3 sync dist/apps/frontend/ s3://$FRONT_END_BUCKET --delete
      # Invalidate cloudfront caches to immediately serve the new front-end files
      - aws cloudfront create-invalidation --distribution-id $CLOUDFRONT_DISTRIBUTION_ID --paths "/index.html"
      # TODO: Push API to Elastic beanstalk

First, we upload the fresh front-end build to the S3 bucket, and then we invalidate the caches for the index.html file, so CloudFront will immediately serve the changes. If you have more static files in your app, you might need to invalidate caches for those as well.

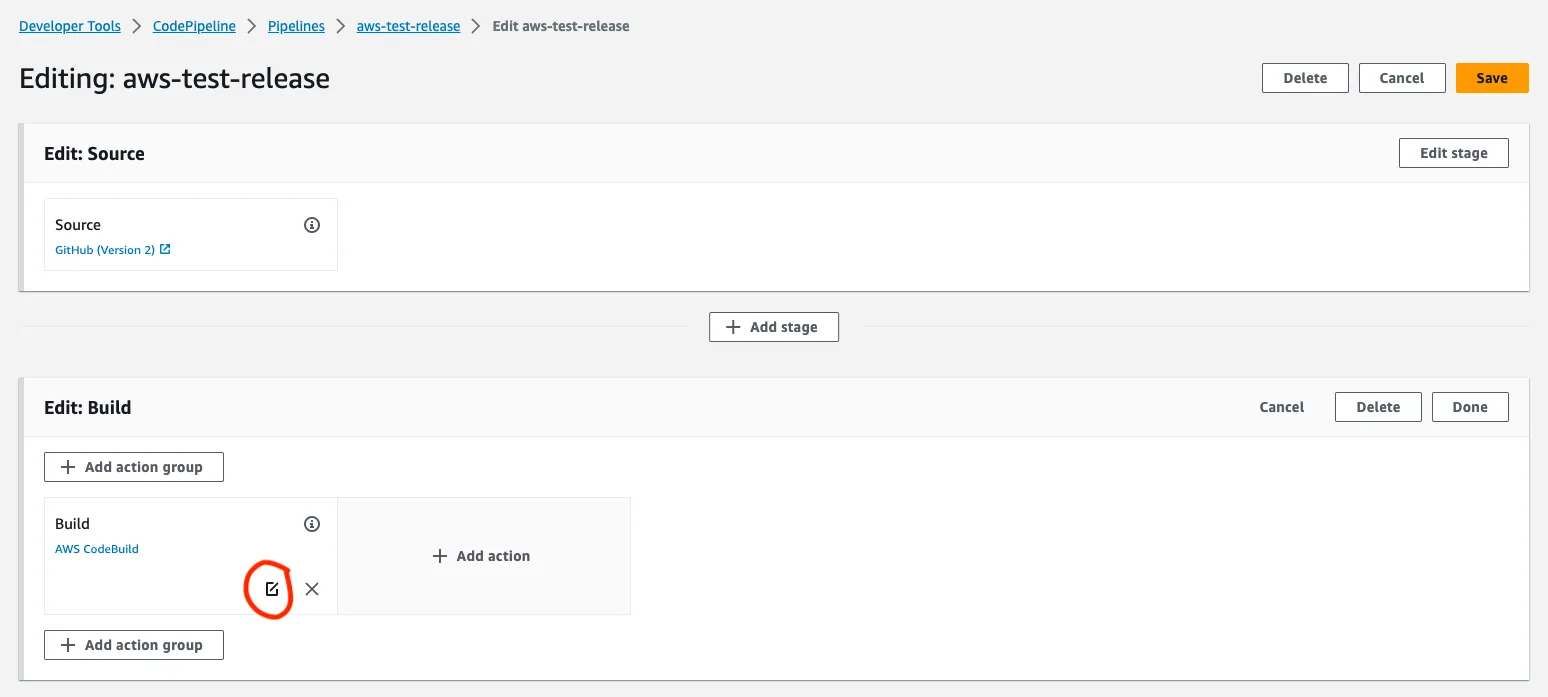
Before we push the above changes up, we need to update the environment variables in our CodePipeline. To do this open the pipeline and click on the Edit button. This will then enable us to edit the Build stage. Edit the build step by clicking on the edit button.

Edit build step

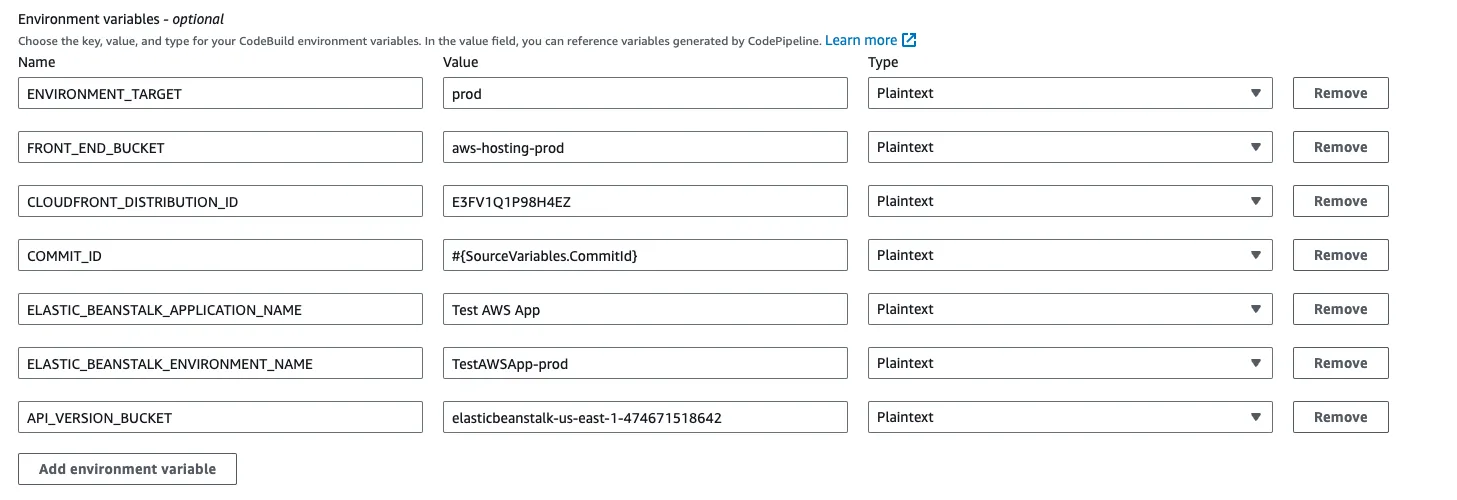
On this screen, we add the new environment variables. For this example, it is aws-hosting-prod as Plaintext for the FRONT_END_BUCKET and E3FV1Q1P98H4EZ as Plaintext for the CLOUDFRONT_DISTRIBUTION_ID

Add new variable

Now if we add changes to our index.html file, for example, change the button to <button id="hello">HELLO 2</button>, commit it and push it. It gets deployed.

Deploying the API to Elastic Beanstalk

We are going to need some environment variables passed down to the build pipeline to be able to deploy to different environments, like staging or prod. We gathered these below:

  • COMMIT_ID: #{SourceVariables.CommitId} - This will have the commit id from the checkout step. We include this, so we can always check what commit is deployed.
  • ELASTIC_BEANSTALK_APPLICATION_NAME: Test AWS App - This is the Elastic Beanstalk app which has your environment associated.
  • ELASTIC_BEANSTALK_ENVIRONMENT_NAME: TestAWSApp-prod - This is the Elastic Beanstalk environment you want to deploy to
  • API_VERSION_BUCKET: elasticbeanstalk-us-east-1-474671518642 - This is the S3 bucket that was created by Elastic Beanstalk
API env variables

With the above variables, we can make some new variables during the build time, so we can make sure that every API version is unique and gets deployed. We set this up in the install phase.

# ...

phases:
  install:
    runtime-versions:
      nodejs: 18
    on-failure: ABORT
    commands:
      - APP_VERSION=`jq '.version' -j package.json`
      - API_VERSION=$APP_VERSION-build$CODEBUILD_BUILD_NUMBER
      - API_ZIP_KEY=$COMMIT_ID-api.zip
      - 'APP_VERSION_DESCRIPTION="$AP_VERSION: $COMMIT_ID"'
      - npm ci
# ...

The APP_VERSION variable is the version property from the package.json file. In a release process, the application's version is stored here. The API_VERSION variable will contain the APP_VERSION and as a suffix, we include the build number. We want to upload this API version by indicating the commit ID, so the API_ZIP_KEY will have this information. The APP_VERSION_DESCRIPTION will be the description of the deployed version in Elastic Beanstalk.

Finally, we are going to update the buildspec file with the actual Elastic Beanstalk deployment steps.

phases:
# ...
  build:
    on-failure: ABORT
    commands:
      # ...

      # ZIP the API
      - zip -r -j dist/apps/api.zip dist/apps/api
      # Upload the API bundle to S3
      - aws s3 cp dist/apps/api.zip s3://$API_VERSION_BUCKET/$ENVIRONMENT_TARGET/$API_ZIP_KEY
      # Create new API version in Elastic Beanstalk
      - aws elasticbeanstalk create-application-version --application-name "$ELASTIC_BEANSTALK_APPLICATION_NAME" --version-label "$API_VERSION" --description "$APP_VERSION_DESCRIPTION" --source-bundle "S3Bucket=$API_VERSION_BUCKET,S3Key=$ENVIRONMENT_TARGET/$API_ZIP_KEY"
      # Deploy new API version
      - aws elasticbeanstalk update-environment --application-name "$ELASTIC_BEANSTALK_APPLICATION_NAME" --version-label "$API_VERSION" --environment-name "$ELASTIC_BEANSTALK_ENVIRONMENT_NAME"
      # Wait until the Elastic Beanstalk environment is stable
      - aws elasticbeanstalk wait environment-updated --application-name "$ELASTIC_BEANSTALK_APPLICATION_NAME" --environment-name "$ELASTIC_BEANSTALK_ENVIRONMENT_NAME"

Let's make a change in the API, for example, the message sent back by the /api/hello endpoint and push up the changes.


Now every time a change is merged to the main branch, it gets pushed to our production deployment. Using these guides, you can set up multiple environments, and you can configure separate CodePipeline instances to deploy from different branches. I hope this guide proved to be helpful to you.

This Dot Labs is a development consultancy that is trusted by top industry companies, including Stripe, Xero, Wikimedia, Docusign, and Twilio. This Dot takes a hands-on approach by providing tailored development strategies to help you approach your most pressing challenges with clarity and confidence. Whether it's bridging the gap between business and technology or modernizing legacy systems, you’ll find a breadth of experience and knowledge you need. Check out how This Dot Labs can empower your tech journey.

You might also like

Nuxt DevTools v1.0: Redefining the Developer Experience Beyond Conventional Tools cover image

Nuxt DevTools v1.0: Redefining the Developer Experience Beyond Conventional Tools

In the ever-evolving world of web development, Nuxt.js has taken a monumental leap with the launch of Nuxt DevTools v1.0. More than just a set of tools, it's a game-changer—a faithful companion for developers. This groundbreaking release, available for all Nuxt projects and being defaulted from Nuxt v3.8 onwards, marks the beginning of a new era in developer tools. It's designed to simplify our development journey, offering unparalleled transparency, performance, and ease of use. Join me as we explore how Nuxt DevTools v1.0 is set to revolutionize our workflow, making development faster and more efficient than ever. What makes Nuxt DevTools so unique? Alright, let's start delving into the features that make this tool so amazing and unique. There are a lot, so buckle up! In-App DevTools The first thing that caught my attention is that breaking away from traditional browser extensions, Nuxt DevTools v1.0 is seamlessly integrated within your Nuxt app. This ensures universal compatibility across browsers and devices, offering a more stable and consistent development experience. This setup also means the tools are readily available in the app, making your work more efficient. It's a smart move from the usual browser extensions, making it a notable highlight. To use it you just need to press Shift + Option + D` (macOS) or `Shift + Alt + D` (Windows): With simple keystrokes, the Nuxt DevTools v1.0 springs to life directly within your app, ready for action. This integration eliminates the need to toggle between windows or panels, keeping your workflow streamlined and focused. The tools are not only easily accessible but also intelligently designed to enhance your productivity. Pages, Components, and Componsables View The Pages, Components, and Composables View in Nuxt DevTools v1.0 are a clear roadmap for your app. They help you understand how your app is built by simply showing its structure. It's like having a map that makes sense of your app's layout, making the complex parts of your code easier to understand. This is really helpful for new developers learning about the app and experienced developers working on big projects. Pages View lists all your app's pages, making it easier to move around and see how your site is structured. What's impressive is the live update capability. As you explore the DevTools, you can see the changes happening in real-time, giving you instant feedback on your app's behavior. Components View is like a detailed map of all the parts (components) your app uses, showing you how they connect and depend on each other. This helps you keep everything organized, especially in big projects. You can inspect components, change layouts, see their references, and filter them. By showcasing all the auto-imported composables, Nuxt DevTools provides a clear overview of the composables in use, including their source files. This feature brings much-needed clarity to managing composables within large projects. You can also see short descriptions and documentation links in some of them. Together, these features give you a clear picture of your app's layout and workings, simplifying navigation and management. Modules and Static Assets Management This aspect of the DevTools revolutionizes module management. It displays all registered modules, documentation, and repository links, making it easy to discover and install new modules from the community! This makes managing and expanding your app's capabilities more straightforward than ever. On the other hand, handling static assets like images and videos becomes a breeze. The tool allows you to preview and integrate these assets effortlessly within the DevTools environment. These features significantly enhance the ease and efficiency of managing your app's dynamic and static elements. The Runtime Config and Payload Editor The Runtime Config and Payload Editor in Nuxt DevTools make working with your app's settings and data straightforward. The Runtime Config lets you play with different configuration settings in real time, like adjusting settings on the fly and seeing the effects immediately. This is great for fine-tuning your app without guesswork. The Payload Editor is all about managing the data your app handles, especially data passed from server to client. It's like having a direct view and control over the data your app uses and displays. This tool is handy for seeing how changes in data impact your app, making it easier to understand and debug data-related issues. Open Graph Preview The Open Graph Preview in Nuxt DevTools is a feature I find incredibly handy and a real time-saver. It lets you see how your app will appear when shared on social media platforms. This tool is crucial for SEO and social media presence, as it previews the Open Graph tags (like images and descriptions) used when your app is shared. No more deploying first to check if everything looks right – you can now tweak and get instant feedback within the DevTools. This feature not only streamlines the process of optimizing for social media but also ensures your app makes the best possible first impression online. Timeline The Timeline feature in Nuxt DevTools is another standout tool. It lets you track when and how each part of your app (like composables) is called. This is different from typical performance tools because it focuses on the high-level aspects of your app, like navigation events and composable calls, giving you a more practical view of your app's operation. It's particularly useful for understanding the sequence and impact of events and actions in your app, making it easier to spot issues and optimize performance. This timeline view brings a new level of clarity to monitoring your app's behavior in real-time. Production Build Analyzer The Production Build Analyzer feature in Nuxt DevTools v1.0 is like a health check for your app. It looks at your app's final build and shows you how to make it better and faster. Think of it as a doctor for your app, pointing out areas that need improvement and helping you optimize performance. API Playground The API Playground in Nuxt DevTools v1.0 is like a sandbox where you can play and experiment with your app's APIs. It's a space where you can easily test and try out different things without affecting your main app. This makes it a great tool for trying out new ideas or checking how changes might work. Some other cool features Another amazing aspect of Nuxt DevTools is the embedded full-featured VS Code. It's like having your favorite code editor inside the DevTools, with all its powerful features and extensions. It's incredibly convenient for making quick edits or tweaks to your code. Then there's the Component Inspector. Think of it as your code's detective tool. It lets you easily pinpoint and understand which parts of your code are behind specific elements on your page. This makes identifying and editing components a breeze. And remember customization! Nuxt DevTools lets you tweak its UI to suit your style. This means you can set up the tools just how you like them, making your development environment more comfortable and tailored to your preferences. Conclusion In summary, Nuxt DevTools v1.0 marks a revolutionary step in web development, offering a comprehensive suite of features that elevate the entire development process. Features like live updates, easy navigation, and a user-friendly interface enrich the development experience. Each tool within Nuxt DevTools v1.0 is thoughtfully designed to simplify and enhance how developers build and manage their applications. In essence, Nuxt DevTools v1.0 is more than just a toolkit; it's a transformative companion for developers seeking to build high-quality web applications more efficiently and effectively. It represents the future of web development tools, setting new standards in developer experience and productivity....

Testing a Fastify app with the NodeJS test runner cover image

Testing a Fastify app with the NodeJS test runner

Introduction Node.js has shipped a built-in test runner for a couple of major versions. Since its release I haven’t heard much about it so I decided to try it out on a simple Fastify API server application that I was working on. It turns out, it’s pretty good! It’s also really nice to start testing a node application without dealing with the hassle of installing some additional dependencies and managing more configurations. Since it’s got my stamp of approval, why not write a post about it? In this post, we will hit the highlights of the testing API and write some basic but real-life tests for an API server. This server will be built with Fastify, a plugin-centric API framework. They have some good documentation on testing that should make this pretty easy. We’ll also add a SQL driver for the plugin we will test. Setup Let's set up our simple API server by creating a new project, adding our dependencies, and creating some files. Ensure you’re running node v20 or greater (Test runner is a stable API as of the 20 major releases) Overview `index.js` - node entry that initializes our Fastify app and listens for incoming http requests on port 3001 `app.js` - this file exports a function that creates and returns our Fastify application instance `sql-plugin.js` - a Fastify plugin that sets up and connects to a SQL driver and makes it available on our app instance Application Code A simple first test For our first test we will just test our servers index route. If you recall from the app.js` code above, our index route returns a 501 response for “not implemented”. In this test, we're using the createApp` function to create a new instance of our Fastify app, and then using the `inject` method from the Fastify API to make a request to the `/` route. We import our test utilities directly from the node. Notice we can pass async functions to our test to use async/await. Node’s assert API has been around for a long time, this is what we are using to make our test assertions. To run this test, we can use the following command: By default the Node.js test runner uses the TAP reporter. You can configure it using other reporters or even create your own custom reporters for it to use. Testing our SQL plugin Next, let's take a look at how to test our Fastify Postgres plugin. This one is a bit more involved and gives us an opportunity to use more of the test runner features. In this example, we are using a feature called Subtests. This simply means when nested tests inside of a top-level test. In our top-level test call, we get a test parameter t` that we call methods on in our nested test structure. In this example, we use `t.beforeEach` to create a new Fastify app instance for each test, and call the `test` method to register our nested tests. Along with `beforeEach` the other methods you might expect are also available: `afterEach`, `before`, `after`. Since we don’t want to connect to our Postgres database in our tests, we are using the available Mocking API to mock out the client. This was the API that I was most excited to see included in the Node Test Runner. After the basics, you almost always need to mock some functions, methods, or libraries in your tests. After trying this feature, it works easily and as expected, I was confident that I could get pretty far testing with the new Node.js core API’s. Since my plugin only uses the end method of the Postgres driver, it’s the only method I provide a mock function for. Our second test confirms that it gets called when our Fastify server is shutting down. Additional features A lot of other features that are common in other popular testing frameworks are also available. Test styles and methods Along with our basic test` based tests we used for our Fastify plugins - `test` also includes `skip`, `todo`, and `only` methods. They are for what you would expect based on the names, skipping or only running certain tests, and work-in-progress tests. If you prefer, you also have the option of using the describe` → `it` test syntax. They both come with the same methods as `test` and I think it really comes down to a matter of personal preference. Test coverage This might be the deal breaker for some since this feature is still experimental. As popular as test coverage reporting is, I expect this API to be finalized and become stable in an upcoming version. Since this isn’t something that’s being shipped for the end user though, I say go for it. What’s the worst that could happen really? Other CLI flags —watch` - https://nodejs.org/dist/latest-v20.x/docs/api/cli.html#--watch —test-name-pattern` - https://nodejs.org/dist/latest-v20.x/docs/api/cli.html#--test-name-pattern TypeScript support You can use a loader like you would for a regular node application to execute TypeScript files. Some popular examples are tsx` and `ts-node`. In practice, I found that this currently doesn’t work well since the test runner only looks for JS file types. After digging in I found that they added support to locate your test files via a glob string but it won’t be available until the next major version release. Conclusion The built-in test runner is a lot more comprehensive than I expected it to be. I was able to easily write some real-world tests for my application. If you don’t mind some of the features like coverage reporting being experimental, you can get pretty far without installing any additional dependencies. The biggest deal breaker on many projects at this point, in my opinion, is the lack of straightforward TypeScript support. This is the test command that I ended up with in my application: I’ll be honest, I stole this from a GitHub issue thread and I don’t know exactly how it works (but it does). If TypeScript is a requirement, maybe stick with Jest or Vitest for now 🙂...

Performance Analysis with Chrome DevTools cover image

Performance Analysis with Chrome DevTools

When it comes to performance, developers often use Lighthouse, Perfbuddy, or similar performance analysis tools. But when the target site has protection against bots, getting information is not that simple. In this blog post, we are going to focus on where to look for signs of performance bottlenecks by using Chrome Devtools. Preparations Even when access to automated performance analysis tools is restricted, the Network, Performance, and Performance Insights tabs of Chrome Devtools can still be leveraged. To do that, some preparations can be made. When starting our analysis, I recommend opening the page we want to analyse in incognito mode. So we separate the analysis from our regular browser habits, cookies, and possible browser extensions. When we load the page for the first time, let's make sure we disable caching in the Network tab, so resources are always fetched when we reload. Some pages heavily rely on client-side storage mechanisms such as indexedDB`, `localStorage`, and `sessionStorage`. Cookies can also interfere. Therefore, it's good to leverage the "Application" tab's `Clear site data` button to make sure lingering data won't interfere with your results. Some antivirus software with network traffic filtering can also interfere with your requests. They can block, slow down, or even intercept and modify certain network requests, which can greatly affect loading time and the accuracy of your results. If the site under analysis is safe, we recommend disabling network traffic filtering temporarily. We strongly suggest just looking at the page and reloading it a few times to get a feeling of its performance. A lot of things cannot be detected by human eyes, but you can look for flickers and content shifts on the page. These performance issues can be good entry points to your investigation. Common bottlenecks: resources Let's start at the Network tab, where we can identify if resources are not optimised. After we reload the page, we can use the filters on the network tab to focus on image resources. Then we can see the information of these requests, including the size of the images, the time it took to load each image, and any errors that occurred. The waterfall chart is also useful. This is where you can see the timing of each image resource loading. We should look for evidence that the image resources are served from a CDN, with proper compression. We can check the resources one by one, and see if they contain Content-Encoding: gzip` or `Content-Encoding: br` headers. If these headers are missing, we found one bottleneck that can be fixed by serving images using gzip or brotli compression while serving them. Headers on resource requests can tell other signs of errors. It can also happen that images are served from a CDN, such as fastly, but if there are fastly-io-error` headers on the resources, it can mean that something is misconfigured. We also need to check the dimensions of the images. If an image is larger than the space it's being displayed in, it may be unnecessarily slowing down the page. If we find such bottlenecks, we can resize the images to match the actual dimensions of the space where they are being displayed to improve loading time. Server-side rendering can improve your SEO altogether, but it is worth checking the size of the index.html file because sometimes it can be counterproductive. It is recommended to try and keep HTML files under 100kb to keep the TTFB (Time To First Byte) metric under 1 second. If the page uses polyfills, it's worth checking what polyfills are in use. IE11 is no longer supported, and loading unnecessary polyfills for that browser slows down the page load time. Performance Insights Tab The performance Insights Tab in Chrome DevTools allows users to measure the page load of a website. This is done by running a performance analysis on the website and providing metrics on various aspects of the page load process, such as the time it takes for the page to be displayed, the time it takes for network resources to be loaded, and the time it takes for the page to be interactive. The performance analysis is run by simulating a user visiting the website and interacting with it, which allows the tool to accurately measure the performance of the page under real-world conditions. This information can then be used to identify areas of the website that may be causing slowdowns and to optimize the performance of the page. Follow the steps to run an analysis: 1. Open the Chrome Devtools 2. Select the "Performance insights" tab 3. Click on the Measure page load button The analysis provides us with a detailed waterfall representation of requests, color coded to the request types. It can help you identify requests that block/slow down the page rendering, and/or expensive function calls that block the main thread. It also provides you with information on important performance metrics, such as DCL (DOM Content Loaded), FCP (First Contentful Paint), LCP (Largest Contentful Paint) and TTI (Time To Interactive). You can also simulate network or CPU throttling, or enable the cache if your use case requires that. DCL refers to the time it takes for the initial HTML document to be parsed and for the DOM to be constructed. FCP refers to the time it takes for the page to display the first contentful element, such as an image or text. LCP is a metric that measures the loading speed of the largest element on a webpage, such as an image or a block of text. A fast LCP helps ensure that users see the page's main content as soon as possible, which can improve the overall user experience. TTI refers to the time it takes for the page to become fully interactive, meaning that all of the necessary resources have been loaded and the page is responsive to user input. Performance Tab The "start profiling and reload page" button in the Performance tab of Chrome DevTools allows users to run a performance analysis on a website and view detailed information about how the page is loading and rendering. By clicking this button, the tool will simulate a user visiting the website and interacting with it, and will then provide metrics and other information about the page load process. Follow the steps to run an analysis 1. Open the Chrome Devtools 2. Select the "Performance" tab 3. Click on the button with the "refresh" icon A very useful part of this view is the detailed information provided on the main thread. We can interact with call stacks and find functions that might run too long, blocking the main thread, and delaying the TTI (Time To Interactive) metric. Selecting a function gives all kinds of information on that function. You can see how long that function was running, and what other functions it called, and you can also directly open that function in the Sources tab. Identifying long-running, blocking functions is crucial in finding performance bottlenecks. One way to mitigate them is to move them into worker threads. --- Chrome DevTools is a powerful tool for analyzing the performance of web applications. By using the network tab, you can identify issues with resources that might slow down page load. With the Performance insights and Performance tabs, we can identify issues that may be causing the website to load slowly, and take steps to optimize the code for better performance. Whether you're a beginner or an experienced developer, Chrome DevTools is an essential tool for analyzing and improving the performance of web applications....

Being a CTO at Any Level: A Discussion with Kathy Keating, Co-Founder of CTO Levels cover image

Being a CTO at Any Level: A Discussion with Kathy Keating, Co-Founder of CTO Levels

In this episode of the engineering leadership series, Kathy Keating, co-founder of CTO Levels and CTO Advisor, shares her insights on the role of a CTO and the challenges they face. She begins by discussing her own journey as a technologist and her experience in technology leadership roles, including founding companies and having a recent exit. According to Kathy, the primary responsibility of a CTO is to deliver the technology that aligns with the company's business needs. However, she highlights a concerning statistic that 50% of CTOs have a tenure of less than two years, often due to a lack of understanding and mismatched expectations. She emphasizes the importance of building trust quickly in order to succeed in this role. One of the main challenges CTOs face is transitioning from being a technologist to a leader. Kathy stresses the significance of developing effective communication habits to bridge this gap. She suggests that CTOs create a playbook of best practices to enhance their communication skills and join communities of other CTOs to learn from their experiences. Matching the right CTO to the stage of a company is another crucial aspect discussed in the episode. Kathy explains that different stages of a company require different types of CTOs, and it is essential to find the right fit. To navigate these challenges, Kathy advises CTOs to build a support system of advisors and coaches who can provide guidance and help them overcome obstacles. Additionally, she encourages CTOs to be aware of their own preferences and strengths, as self-awareness can greatly contribute to their success. In conclusion, this podcast episode sheds light on the technical aspects of being a CTO and the challenges they face. Kathy Keating's insights provide valuable guidance for CTOs to build trust, develop effective communication habits, match their skills to the company's stage, and create a support system for their professional growth. By understanding these key technical aspects, CTOs can enhance their leadership skills and contribute to the success of their organizations....