Skip to content

GraphQL is the new REST — Part 1

GraphQL is the new REST - 1 Part Series

This article was written over 18 months ago and may contain information that is out of date. Some content may be relevant but please refer to the relevant official documentation or available resources for the latest information.

GraphQL is a new API standard and offers a revolutionary approach to building data-driven applications. The project was first created by Facebook while they were shifting their mobile app from HTML5 to native mobile app.

Only In 2015 did GraphQL open to the public as an open-source project.

The major features and benefits of GraphQL urge you to rethink the way you build your clients’ apps and the way they communicate with backend servers to query or mutate data. For instance, GraphQL is:

  • A powerful query language used to communicate data between a client browser and a server.

  • An application-level query language rather than a database query language.

  • Platform-agnostic, whether on the server-side or client-side, GraphQL can embed itself seamlessly with many programming languages, provided an integration is in place (C#, Go, Java, Python, Node.js, etc.).

  • Database-agnostic, enabling you to connect GraphQL to any database of choice by providing the required hooks by GraphQL.

  • Dedicated to a declarative data fetching approach. Within a GraphQL query, you define exactly what data or fields you are querying for and what input filters you are sending. You compose a query from objects and sub-objects as per your needs.

  • An alternative to RESTful and a more flexible approach to manage data in your apps.

RESTful approach vs GraphQL approach

Let’s say that, in our app, we are tracking data about Books and Authors. With RESTful, you would define a REST API and expose multiple endpoints that a client app could communicate with.

For instance, you would define the following API endpoints:

  • /my-domain/Books — GET all books

  • /my-domain/Books/1 — GET book with ID = 1

  • /my-domain/Authors — GET all authors

  • /my-domain/Authors/1 — GET author with ID = 1

The cycle starts by requesting all books (/Books) in the library. With a book, you receive the Author ID. To get details about the author, you issue a new request to the REST API on a different endpoint (/Authors/1) to get the Author. With an author, you receive list of Book IDs written by this author. To get the details for a certain book, you issue a new request to the REST API on a different endpoint (/Books/1).

With REStful, the app is in continuous communication mode with the server to query the data and traverse it.

GraphQL is your saving grace. The above communication between the client and the server can be summarized with a single GraphQL query.

query {
	books {
		id
		name
		genre
		author {
			id
			name
			age
			books {
				id
				name
			}
		}
	}
}

The GraphQL standard allows you to build a graph of related data in the most efficient and concise way.

With a single query, you retrieve information about the books, the author of each book and all the books authored by that author.

In this series of articles (Part 1 and Part 2, we will build together a GraphQL Server API and a GraphQL Client app to communicate in a GraphQLful way.

Learning by example

The best way to learn GraphQL syntax and concepts is to build your own GraphQL Server API and Client app. I will take you through the process of building a GraphQL Server API on top of Node.js and Express engine. At the same time, I will be using Angular 7 to build a client app to utilize the GraphQL Server API and perform CRUD operations for managing Books and Authors.

In Part 1 of this article, we will build the GraphQL Server API. In Part 2, we will build the GraphQL Angular Client app.

You can find the source code for this article on Github by following this link GraphQL CRUD repo.

Build the GraphQL Server API

The GraphQL API Server will be a Node.js application. Follow these steps to get your GraphQL server up and running.

Create a wrapping folder for the application

Start by creating a new folder named graphql-crud. This folder will hold the source code for both the client and the server.

Add the main JavaScript file for the Node.js app

Add a new folder named server inside the graphql-crud folder. Inside this new folder, create a new JS file named app.js. This file is the main Node.js file that will start the whole server-side application.

Let’s now add some NPM packages that we will necessary when building the server. Issue the following command:

npm install express express-graphql graphql mongoose cors — save

express: Enables the Node.js app to listen to requests and server responses.

express-graphql: Enables the Node.js app to understand and process GraphQL requests/responses.

graphql: The JavaScript reference implementation for GraphQL.

mongoose: An ORM to use MongoDB inside a Node.js app. We will be storing our data inside a MongoDB instance using mLab free and online service.

cors: A Node.js package for providing a Connect/Express middleware that can be used to enable CORS with various options.

Require the libraries needed into app.js file

Require the following libraries at the beginning of app.js file:

const express = require('express');

// Import GraphQL middleware
const expressGraphQL = require('express-graphql');

// Import Mongo Db Client API
const mongoose = require('mongoose');

// Import CORs middleware to allow connections from another URL:PORT
const cors = require('cors');

Create the App instance and connect to MongoDB instance

To create a Node.js app instance:

const app = express();

To enable CORS on the Node.js app instance:

app.use(cors());

To connect to a MongoDB instance:

mongoose.connect(‘{CONNETION_STRING}’);

Wondering how to obtain a connection string to a MongoDB instance? If you are following this article and using mLab online service, I suggest you create an account for yourself on mLab and then create a new MongoDB instance. Don’t forget to create a database user and password for the newly created database instance. Once a username and password are created, mLab provide you with a connection string that you grab and put in the line of code above.

Finally, configure the Node.js app to listen on Port 4000 for incoming requests.

app.listen(4000, () => {
    console.log('Listening for requests on port 4000');
});

Add GraphQL middleware

Express allows external APIs or packages to hook into the request/response model by means of a middleware. To redirect all requests coming on /graphql to the GraphQL middleware, configure the Node.js app with the following: (Add the code just above the app.listen())

app.use('/graphql', expressGraphQL({
    schema,
    graphiql: true
}));

Any request to /graphql is now handled by expressGraphQL middleware. This middleware requires passing as a parameter the schema to be used by the GraphQL Server API. We will define this schema soon below. The graphiql: true option enables an in-browser IDE to run your queries and mutations against the GraphQL Server. This is very helpful when testing your GraphQL Server API before having an actual client app connected to the server.

GraphQL Schema

GraphQL flexibility is governed by the flexibility your API provides in terms of which object types can be queried or mutated and which fields belonging to the object types that can be returned by the API and consumed by the clients. This all depends on the schema and object types that you build and configure with the GraphQL Server. At the end of the day, GraphQL will validate a query or mutation based on a set of rules that the developer of the API has provided depending on a certain schema. This is the real power of GraphQL.

A GraphQL Schema is more or less analogous to a RESTful API route tree. Defining a schema means:

  • You tell the GraphQL Server about the object types to expect, whether in the body of the queries/mutations or in the response generated by those queries/mutations.

  • You build the valid “Endpoints” that the GraphQL Server exposes to client applications.

Build a GraphQL Schema

Create a new JavaScript file schema.js inside a new folder named schema. Import the GraphQL library at the top of the file as follows:

const graphQL = require(‘graphql’);

Next, import some of the GraphQL types to be used later throughout the code:

const {
  GraphQLObjectType,
  GraphQLString,
  GraphQLSchema,
  GraphQLID,
  GraphQLInt,
  GraphQLList,
  GraphQLNonNull
} = graphQL;

We are using the ES6 destructuring feature to extract the types from graphql-js package. We will be using those types to define our schema below.

A schema is defined by query and mutation.

A query is a root endpoint exposing all available query API endpoints to the client apps.

A mutation is a root endpoint exposing all available mutation (update, create or delete) API endpoints to the client apps.

module.exports = new GraphQLSchema({
  query: RootQuery,
  mutation: Mutation
});

We define the RootQuery as follows:

const RootQuery = new GraphQLObjectType({
  name: 'RootQueryType',
  fields: {
    book: {
      // book() {} endpoint
      type: BookType,
      args: {
        id: {
          type: GraphQLID
        }
      },
      resolve(parent, args) {
        // mongoose api call to return a book by ID
      }
    },
    author: {
      // author() {} endpoint
      type: AuthorType,
      args: {
        id: {
          type: GraphQLID
        }
      },
      resolve(parent, args) {
        // mongoose api call to return the book author
      }
    },
    books: {
      // books {} endpoint
      type: new GraphQLList(BookType),
      resolve(parent, args) {
        // mongoose api call to return all books
      }
    },
    authors: {
      // authors {} endpoint
      type: new GraphQLList(AuthorType),
      resolve(parent, args) {
        // mongoose api call to return authors
      }
    }
  }
});

The RootQuery object is of type GraphQLObjectType. It has a name of RootQueryType and an array of fields. The array of fields is actually an array of endpoints that the client apps can use to query the GraphQL Server API.

Let’s explore one of the endpoints. The rest will be similar.

book: {
      // book() {} endpoint
      type: BookType,
      args: {
        id: {
          type: GraphQLID
        }
      },
      resolve(parent, args) {
        // mongoose api call to return a book by ID
      }
    }

To define an endpoint, you provide the following fields:

type: The data that this endpoint returns. In this case, it is the BookType. We will get back to this type shortly.

args: The arguments that this endpoint accepts to filter the data accordingly and return a response. In this case, the code defines a single argument named id and is of type GraphQLID. This is a special type provided by GraphQL to indicate that this field is an ID of the object rather than a normal field.

resolve: A function that gets called by GraphQL whenever it is executing the book query endpoint. This function should be implemented by the developer to return a Book type based on the id argument passed to this query. We will fill in the gaps later on when we connect to a MongoDB instance to retrieve a book based on its id. The resolve() function receives as arguments the parent object (if any) and the list of arguments packaged under the args input parameter. Therefore, to access the book id passed to this query, you do it by args.id.

That’s the power of GraphQL. It allows you, the author, to build a graph of objects with instructions in the form of resolve() functions, to tell GraphQL how to query for a sub-object by executing the resolve() function, and so on.

The BookType is defined as follows:

const BookType = new GraphQLObjectType({
  name: 'Book',
  fields: () => ({
    // Fields exposed via query
    id: {
      type: GraphQLID
    },
    name: {
      type: GraphQLString
    },
    genre: {
      type: GraphQLString
    },
    author: {
      // How to retrieve Author on a Book object
      type: AuthorType,
      /**
       * parent is the book object retrieved from the query below
       */
      resolve(parent, args) {
        // mongoose api call to return the book author by authorId
      }
    }
  })
});

Define an object type by using GraphQLObjectType. A type is defined by providing the name Book in our case. In addition, you return an object with all the available fields on the book type inside the fields() function. The fields defined on the object type are the only fields available for a query response.

The Book type in our case defines the following fields:

  • An id field of type GraphQLID

  • A name field of type GraphQLString

  • A genre field of type GraphQLString

  • An author field of type AuthorType. AuthorType is another custom object type that we define ourselves. This field is special because it defines a resolve() function. This function receives two input parameters: parent and args. The parent parameter is the actual Book object queries by GraphQL. When GraphQL wants to return a field of type custom object type, it will execute the resolve() function to return this object. Later on, we will add the mongoose API call to retrieve an author from the database by means of Book.authorId field. This is the beauty of GraphQL in giving the developer of the API the upper hand to define the different pathways that GraphQL can use to traverse the object model and return a single response per query, no matter how complicated the query is.

Let’s define the Mutation object used by the schema.

const Mutation = new GraphQLObjectType({
  name: 'Mutation',
  fields: {
    addBook: {
      // addBook() {} endpoint
      type: BookType,
      args: {
        name: {
          type: new GraphQLNonNull(GraphQLString)
        },
        genre: {
          type: new GraphQLNonNull(GraphQLString)
        },
        authorId: {
          type: new GraphQLNonNull(GraphQLID)
        }
      },
      resolve(parent, args) {
        // mongoose api call to insert a new book object and return it as a reponse
      }
    },
  }
});

Similar to the RootQuery object, the Mutation object defines the API endpoints that can be used by client apps to mutate or change the data. We will go through one of the mutations here, and the rest are available on the Github repo.

The code fragment defines the addBook endpoint. This endpoint returns data of type BookType. It receives name, genre and authorId as input parameters. Notice how we can make input parameters mandatory by using the GraphQLNonNull object. In addition, this mutation defines the resolve() function. This function is executed by GraphQL when this endpoint is called. The resolve() function should contain code to insert or add a new Book object to the MongoDB.

Now that the GraphQL is defined, let’s explore an example of how to connect to MongoDB using the mongoose client API.

Connect to MongoDB via mongoose API

Let’s start by defining the schema of the database that mongoose will connect to. To do so, create a new folder named models. Then, for each collection or table in the relational database terms, you add a JavaScript file and define the mongoose model object.

For now, add the book.js file with the following code:

const mongoose = require('mongoose');
const Schema = mongoose.Schema;
const bookSchema = new Schema({
   /**
   * No need to add "id" column
   * It is being created by mLab as "_id"
   */
   name: String,
   genre: String,
   authorId: String
});
module.exports = mongoose.model('Book', bookSchema);

This is the mongoose way of defining a collection inside MongoDB. This collection will be created inside the MongoDB database the first time it connects to the database instance and doesn’t find a collection there.

The Book collection in our case defines the name, genre, and authorId fields.

Let’s import this collection to our schema.js file and connect to MongoDB. The rest of the collections are available on the Github repo.

Start by requiring or importing the Book collection as follows:

const Book = require(‘../models/book’);

Now let’s revisit the book query endpoint and implement its resolve() function to return an actual book from the database:

book: {
      // book() {} endpoint
      type: BookType,
      args: {
        id: {
          type: GraphQLID
        }
      },
      resolve(parent, args) {
        return Book.findById(args.id);
      }
    }

Simply by calling the findById() function on the Book model, you are retrieving a Book object based on its id field.

The rest of the mongoose API calls are available on the Github repo.

Now that the GraphQL schema is ready and we’ve already configured the Express-GraphQL middleware with this schema, it’s showtime!

Demonstrate the Graphiql IDE

Run the server app by issuing the following command:

node app.js

The server is now up and running on PORT 4000. Let’s open a browser and visit this URL: http://localhost:4000/graphiql

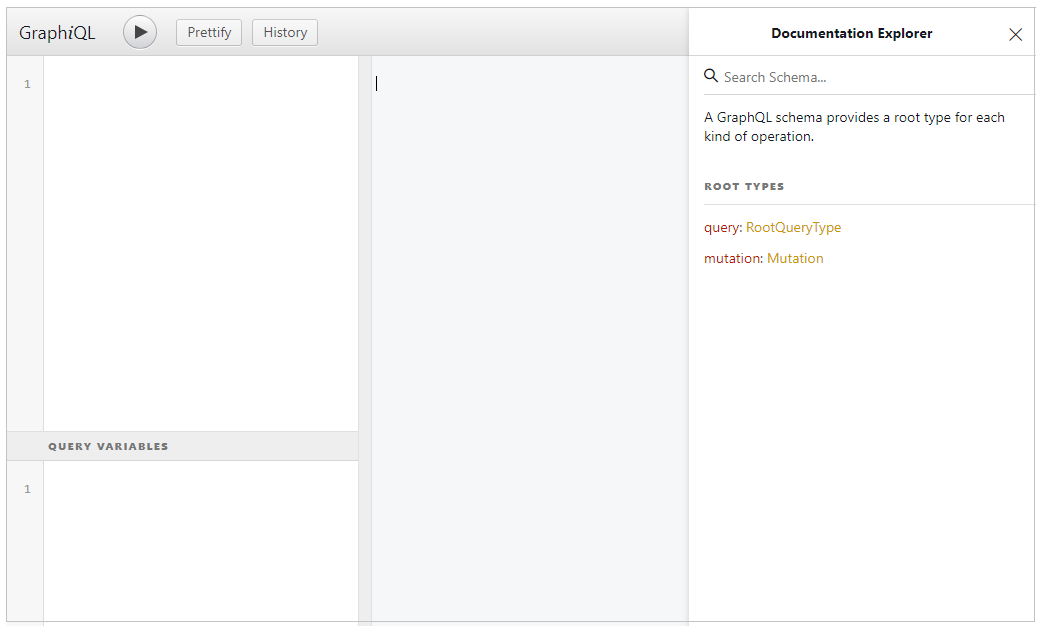
On the left side you can type in your queries or mutations.

In the middle is the results panel, where the results of a query or mutation are displayed.

On the right side you find the Documentation Explorer. You can use it to diagnose the documentation of the GraphQL Server API. Here you are able to see the available queries and mutations, together with their details, as well as how to construct the queries and which fields are available to you.

Let’s add a single book by typing the following GraphQL query. Check the GraphQL website for a complete reference on how to construct queries and mutations.

mutation addBook($name: String!, $genre: String!, $authorId: ID!) {
	addBook(name: $name, genre: $genre, authorId: $authorId) {
		id
	   	name
	} 
}

In the Query Variables section of the panel, on the left side, add the following variables:

{
  "name":"Learning GraphQL",
  "genre": "APIs", 
  "authorId": "cjktxh5i50w53yul6lp4n"
}

The mutation above creates a new Book record with a certain name, genre, and authorId and returns the id and name of the newly created Book.

The response generated by the above mutation is as follows:

{
  id: ecjkv56ab219vireudxw
  name: “Learning GraphQL”
}

To query this book, you issue the following:

query {
	book (id: “ecjkv56ab219vireudxw”) {
		Name
		Genre
	}
}

Now, the GraphQL Server API is up and running. Let’s switch gears and build the GraphQL Angular Client app in Part 2 of this series.

Conclusion

GraphQL is considered a recent addition to technology. With its rapid momentum, it looks like it will replace the REStful in terms of accessing and manipulating data in our applications.

In this first part of the series on GraphQL, we’ve built together a GraphQL Server API on top of Node.js Express. In Part 2 of this series, we will build a GraphQL Client app with Angular.

Stay tuned!

This Dot is a consultancy dedicated to guiding companies through their modernization and digital transformation journeys. Specializing in replatforming, modernizing, and launching new initiatives, we stand out by taking true ownership of your engineering projects.

We love helping teams with projects that have missed their deadlines or helping keep your strategic digital initiatives on course. Check out our case studies and our clients that trust us with their engineering.

You might also like

Efficiently Extract Object References in Shopify Storefront GraphQL API cover image

Efficiently Extract Object References in Shopify Storefront GraphQL API

Efficiently Extract Object References in Shopify Storefront GraphQL API Introduction So, this blog post is born out of necessity and a bit of frustration. If you're diving into the world of Shopify's Storefront API, you've probably realized that while it's powerful, extracting data in the object reference from Metadata fields or Metaobjects (in the GraphQL query) can be a bit like searching for a needle in a haystack. This complexity often arises not from the API's lack of capabilities but from the sparse and sometimes unclear documentation on this specific aspect. That's precisely why I decided to create this post. As a developer, I found myself in a situation where the documentation and community resources were either scarce or not detailed enough for the specific challenges I faced. This guide is the result of my journey - from confusion to clarity. The Situation To understand the crux of my challenge, it's essential to recognize that creating metafields and metaobjects is a common practice for those seeking a more customized and controlled experience with Shopify CMS. In my specific case, I wanted to enrich the information available for each product's vendor beyond what Shopify typically allows, which is just a single text box. I aimed to have each vendor display their name and two versions of their logo: a themed logo that aligns with my website's color scheme and an original logo for use on specific pages. The challenge emerged when I fetched a list of all vendors to display on a page. My GraphQL query for the Storefront API looked like this: ` This was when I hit a roadblock. How do I fetch a field with a more complex type than a simple text or number, like an image? To retrieve the correct data, what specific details must I include in the originalLogo and themedLogo fields? In my quest for a solution, I turned to every resource I could think of. I combed through the Storefront API documentation, searched endlessly on Stack Overflow, and browsed various tech forums. Despite all these efforts, I couldn’t find the clear, detailed answers I needed. It felt like I was looking for something that should be there but wasn’t. Solution Before diving into the solution, it's important to note that this is the method I discovered through trial and error. There might be other approaches, but I want to share the process that worked for me without clear documentation. My first step was to understand the nature of the data returned by the Storefront API. I inspected the value of a metaobject, which looked something like this: ` The key here was the gid, or global unique identifier. What stood out was that it always includes the object type, in this case, MediaImage. This was crucial because it indicated which union to use and what properties to query from this object in the Storefront API documentation. So, I modified my query to include a reference to this object type, focusing on the originalLogo field as an example: ` The next step was to consult the Storefront API documentation for MediaImage at Shopify API Documentation. Here, I discovered the image field within MediaImage, an object containing the url field. With this information, I updated my query: ` Finally, when executing this query, the output for a single object was as follows: ` Through this process, I successfully extracted the necessary data from the object references in the metafields, specifically handling more complex data types like images. Conclusion In wrapping up, it's vital to emphasize that while this guide focused on extracting MediaImage data from Shopify's Storefront API, the methodology I've outlined is broadly applicable. The key is understanding the structure of the gid (global unique identifier) and using it to identify the correct object types within your GraphQL queries. Whether you're dealing with images or any other data type defined in Shopify's Storefront API, this approach can be your compass. Dive into the API documentation, identify the object types relevant to your needs, and adapt your queries accordingly. It's a versatile strategy that can be tailored to suit many requirements. Remember, the world of APIs and e-commerce is constantly evolving, and staying adaptable and resourceful is crucial. This journey has been a testament to the power of perseverance and creative problem-solving in the face of technical challenges. May your ventures into Shopify's Storefront API be equally rewarding and insightful....

How to Leverage Apollo Client Fetch Policies Like the Pros cover image

How to Leverage Apollo Client Fetch Policies Like the Pros

Apollo Client provides a rich ecosystem and cache for interfacing with your GraphQL APIs. You write your query and leverage the useQuery hook to fetch your data. It provides you with some state context and eventually resolves your query. That data is stored in a local, normalized, in-memory cache, which allows Apollo Client to respond to most previously run requests near instantaneously. This has huge benefits for client performance and the feel of your apps. However, sometimes Apollo's default doesn't match the user experience you want to provide. They provide fetch policies to allow you to control this behavior on each query you execute. In this article, we'll explore the different fetch policies and how you should leverage them in your application. cache-first This is the default for Apollo Client. Apollo will execute your query against the cache. If the cache can fully fulfill the request, then that's it, and we return to the client. If it can only partially match your request or cannot find any of the related data, the query will be run against your GraphQL server. The response is cached for the next query and returned to the handler. This method prioritizes minimizing the number of requests sent to your server. However, it has an adverse effect on data that changes regularly. Think of your social media feeds - they typically contain constantly changing information as new posts are generated. Or a real-time dashboard app tracking data as it moves through a system. cache-first is probably not the best policy for these use cases as you won't fetch the latest data from the upstream source. You can lower the cache time of items for the dashboard to avoid the staleness issue and still minimize the requests being made, but this problem will persist for social media feeds. The cache-first policy should be considered for data that does not change often in your system or data that the current user fully controls. Data that doesn't change often is easily cached, and that's a recommended pattern. For data that the user controls, we need to consider how that data changes. If only the current user can change it, we have 2 options: Return the updated data in the response of any mutation which is used to update the cache Use cache invalidation methods like refetchQueries or onQueryUpdated These methods will ensure that our cache stays in sync with our server allowing the policy to work optimally. However, if other users in the system can make changes that impact the current user's view, then we can not invalidate the cache properly using these strategies which makes this policy unideal. network-only This policy skips the cache lookup and goes to the server to fetch the results. The results are stored in the cache for other operations to leverage. Going back to the example I gave in my explanation cache-first of a social media feed, the network-only policy would be a great way to implement the feed itself as it's ever-changing, and we'll likely even want to poll for changes every 10s or so. The following is an example of what this component could look like: ` Whenever this SocialFeed component is rendered, we always fetch the latest results from the GraphQL server ensuring we're looking at the current data. The results are put in the cache which we can leverage in some children components. cache-only cache-only only checks the cache for the requested data and never hits the server. It throws an error if the specified cache items cannot be found. At first glance, this cache policy may seem unhelpful because it's unclear if our cache is seeded with our data. However, in combination with the network-only policy above, this policy becomes helpful. This policy is meant for components down tree from network-only level query. This method is for you if you're a fan of React components' compatibility. We can modify the return of our previous example to be as follows: ` Notice we're not passing the full post object as a prop. This simplifies our Post component types and makes later refactors easier. The Post would like like the following: ` In this query, we're grabbing the data directly from our cache every time because our top-level query should have fetched it. Now, a small bug here makes maintainability a bit harder. Our top-level GetFeed query doesn't guarantee fetching the same fields. Notice how our Post component exports a fragment. Fragments are a feature Apollo supports to share query elements across operations. In our SocialFeed component, we can change our query to be: ` Now, as we change our Post to use new fields and display different data, the refactoring is restricted to just that component, and the upstream components will detect the changes and handle them for us making our codebase more maintainable. Because the upstream component is always fetching from the network, we can trust that the cache will have our data, making this component safe to render. With these examples, though, our users will likely have to see a loading spinner or state on every render unless we add some server rendering. cache-and-network This is where cache-and-network comes to play. With this policy, Apollo Client will run your query against your cache and your GraphQL server. This further simplifies our example above if we want to provide the last fetched results to the user but then update the feed immediately upon gathering the latest data. This is similar to what X/Twitter does when you reload the app. You'll see the last value that was in the cache then it'll render the network values when ready. This can cause a jarring user experience though, if the data is changing a lot over time, so I recommend using this methodology sparsely. However, if you wanted to update our existing example, we'd just change our SocialFeed component to use this policy, and that'll keep our client and server better in sync while still enabling 10s polling. no-cache This policy is very similar to the network-only policy, except it bypasses the local cache entirely. In our previous example, we wrote engagement as a sub-selector on a Post and stored fields there. These metrics can change in real time pretty drastically. Chat features, reactions, viewership numbers, etc., are all types of data that may change in real time. The no-cache policy is good when this type of data is active, such as during a live stream or within the first few hours of a post going out. You may typically want to use the cache-and-network policy eventually but during that active period, you'll probably want to use no-cache so your consumers can trust your data. I'd probably recommend changing your server to split these queries and run different policies for the operations for performance reasons. I haven't mentioned this yet, but you can make the fetch policy on a query dynamic, meaning you combine these different policies' pending states. This could look like the following: ` We pass whether the event is live to the component that then leverages that info to determine if we should cache or not when fetching the chat. That being said, we should consider using subscription operations for this type of feature as well, but that's an exercise for another blog post. standby This is the most uncommon fetch policy, but has a lot of use. This option runs like a cache-first query when it executes. However, by default, this query does not run and is treated like a "skip" until it is manually triggered by a refetch or updateQueries caller. You can achieve similar results by leveraging the useLazyQuery operator, but this maintains the same behavior as other useQuery operators so you'll have more consistency among your components. This method is primarily used for operations pending other queries to finish or when you want to trigger the caller on a mutation. Think about a dashboard with many filters that need to be applied before your query executes. The standby fetch policy can wait until the user hits the Apply or Submit button to execute the operation then calls a await client.refetchQueries({ include: ["DashboardQuery"] }), which will then allow your component to pull in the parameters for your operation and execute it. Again, you could achieve this with useLazyQuery so it's really up to you and your team how you want to approach this problem. To avoid learning 2 ways, though, I recommend picking just one path. Conclusion Apollo Client's fetch policies are a versatile and helpful tool for managing your application data and keeping it in sync with your GraphQL server. In general, you should use the defaults provided by the library, but think about the user experience you want to provide. This will help you determine which policy best meets your needs. Leveraging tools like fragments will enable you to manage your application and use composable patterns more effectively. With the rise of React Server Components and other similar patterns, you'll need to be wary of how that impacts your Apollo Client strategy. However, if you're on a legacy application that leverages traditional SSR patterns, Apollo allows you to pre-render queries on the server and their related cache. When you combine these technologies, you'll find that your apps perform great, and your users will be delighted....

Making sense of Multiple v-model Bindings in Vue 3 cover image

Making sense of Multiple v-model Bindings in Vue 3

This article is one of a series of articles on what’s new in Vue 3. If you haven’t checked that series yet, you can do so by visiting the links below: - Take your App to the Next Level with Vue 3 - Async Components in Vue 3 - Teleporting in Vue 3 - Your first Vue 3 app using TypeScript - Vue 3 Composition API, do you really need it? In this installment, I will introduce the new v-model in Vue 3 and go through a new feature that allows you to use multiple v-model on the same component! By design, the v-model directive allows us to bind an input value to the state of an app. We use it to create a two-way data binding on the form input, textarea, and select elements. It handles updates in two opposite directions: When the input value changes, it reflects the value onto the state inside the Component. When the Component state changes, it reflects the changes onto the form input elements. The core concept of v-model remains the same in Vue 3 with more enhancements and features. Let’s dig in! Vue 2: v-model Vue 2 supports a single v-model on any given Component. In Vue 2, to build a complex Component that supports two-way data binding, it utilizes a single v-model with one full-blown payload. The Component handles the state internally for all the input elements. It generates a single payload object representing the state of the Component. Finally, it emits an event to the parent Component with the payload attached. This method had several pitfalls, especially for creating Vue UI Libraries. Of these pitfalls is the vagueness of the payload interface. It’s unclear what’s being included in the payload. A developer had to loop through the payload object in order to uncover what properties were there. Another is the need to write the logic inside the Component to handle the internal state and the generation of the payload object. Shortly, we will uncover what has been improved in this regard with Vue 3. However, before this, let’s review some basics on how Vue 2 handles implementing two-way data binding in Components. Vue 2: Two-way Data Binding As mentioned, Vue 2 uses the v-model directive to support two-way data binding on Components. Internally, it follows certain steps and rules in order to support the v-model directive. By default, the v-model directive uses different properties and emits different events for different input elements: Text and Textarea elements use the value property and the input event Checkboxes and Radio buttons use the checked property and the change event Select fields use the input property and the change event. Building a Component with a single input element will internally use something similar to the snippet below: ` The custom Component above defines a single prop named value as follows: ` Then, in the parent Component, you use the new custom Component as follows: ` The v-model directive assumes that the CustomComponent defines an internal property named value and emits a single event named input. What if the CustomComponent has to handle multiple inputs? How do we accomplish that in Vue 2? Well, there is no official solution. However, there are two methods that you can use: The CustomComponent defines a single property named value of type Object. Internally, it parses the object into data fields and does the mapping manually on the template. On every change of any of the fields, it prepares a payload for all the fields and emits a single input event, and attaches the payload. That’s a lot of code to write for such a custom component. The other option is to skip using the v-model directive and instead utilize individual input/event pairs. I will illustrate this in a moment. Assuming you have a custom Component to handle the user’s first name and last name, you would employ something similar: ` As for the properties, the Component defines the following: ` Finally, the parent Component uses the new component as follows: ` We are not using the v-model anymore and providing multiple two-way data bindings on the new component. Further your understanding by reading the official docs on Using v-model on Components Vue 3: v-model In Vue 3, the v-model directive has had an overhaul to give developers more power and flexibility when building custom components that support two-way data binding. The v-model directive now supports new defaults. The default v-model property is renamed to modelValue instead of the old name of value. The default v-model event is renamed to update:modelValue instead of the old name of input. You might be thinking that's more typing when using the new v-model directive. The Vue team are one step ahead and have given you a shorthand to use instead. Let’s rebuild the custom component using it. ` The custom component defines a single prop named modelValue as follows: ` Then, in the parent component, use the new custom component as follows: ` The new v-model directive offers the new shorthand that is used like this: ` The v-model directive assumes that the CustomComponent defines an internal property named modelValue and emits a single event named update:ModelValue. In case you don’t want to use the default naming convention, feel free to use another name. Just remember to be consistent when naming properties. Here’s an example of using a custom name for the modelValue property. ` The custom component above defines a single prop named modelValue as follows: ` Then, in the parent component, you use the new custom component like so: ` Notice the use of the property fullName instead of the default property name. Vue 3: Multiple v-model directive bindings I hope the Vue 3 shorthand form of the v-model directive has given you a "hand up". With this, the v-model gives the flexibility to use multiple v-model directives on a single component instance. The modelValue can be renamed to whatever you want, allowing you to do this! This great new feature eliminates the previous two solutions I offered up on handling complex custom components for Vue 2. Let's jump in and go through an example demonstration! Demo - Multiple v-model directive bindings Let’s build a custom Address component that can be embedded in any form to collect a user’s address. > You can play with the example live on: vue3-multiple-v-model. > You can check the source code for the example on: vue3-multiple-v-model. Figure 1 below shows the final app in action. Let’s start by building the HTML template of the new component. Figure 1 shows that all the fields used are of type input elements. Except for the last one which is a checkbox element. Therefore, it’s suffice to focus on a single input field that will eventually be replicated for the rest of fields. ` The address-line input field binds the :value directive and the @input event as per the new v-model directive specifications in Vue 3. The component defines the following property: ` The other fields follow the same structure and naming convention. Let’s look at the checkbox field and see how it’s defined: ` In the case of a checkbox field element, we bind to the :checked directive instead of the :value directive. Also, we use the @change event instead of the @input event as in the case of input field elements. The event name follows the same standard way of emitting events in the new v-model directive. The component defines the following property: ` Let’s now embed the new custom Address component into the App component: ` For each and every property on the custom component, we bind using the v-model:{property-name} format. The modelValue was replaced with the specific property names we have in hand. When there was a single input binding, the shorthand format was so much easier. However, when there are multiple input elements, the modelValue is in a league of its own! Now, let’s define the properties inside the App component using the new Composition API setup() function: ` You create a new reactive property with an object payload. Finally, you return the reactive property to the component and use it to set bindings on the custom Address component as follows: ` That’s it! Conclusion Vue 3 has many new features and improvements. Today, we saw how we use multiple v-model directives on a single component instance. There is so much more to learn and uncover in Vue 3. The coming installments of this series will continue to look at different features to help you move from Vue 2 to Vue 3. Happy Vueing!...

The Importance of a Scientific Mindset in Software Engineering: Part 2 (Debugging) cover image

The Importance of a Scientific Mindset in Software Engineering: Part 2 (Debugging)

The Importance of a Scientific Mindset in Software Engineering: Part 2 (Debugging) In the first part of my series on the importance of a scientific mindset in software engineering, we explored how the principles of the scientific method can help us evaluate sources and make informed decisions. Now, we will focus on how these principles can help us tackle one of the most crucial and challenging tasks in software engineering: debugging. In software engineering, debugging is often viewed as an art - an intuitive skill honed through experience and trial and error. In a way, it is - the same as a GP, even a very evidence-based one, will likely diagnose most of their patients based on their experience and intuition and not research scientific literature every time; a software engineer will often rely on their experience and intuition to identify and fix common bugs. However, an internist faced with a complex case will likely not be able to rely on their intuition alone and must apply the scientific method to diagnose the patient. Similarly, a software engineer can benefit from using the scientific method to identify and fix the problem when faced with a complex bug. From that perspective, treating engineering challenges like scientific inquiries can transform the way we tackle problems. Rather than resorting to guesswork or gut feelings, we can apply the principles of the scientific method—forming hypotheses, designing controlled experiments, gathering and evaluating evidence—to identify and eliminate bugs systematically. This approach, sometimes referred to as "scientific debugging," reframes debugging from a haphazard process into a structured, disciplined practice. It encourages us to be skeptical, methodical, and transparent in our reasoning. For instance, as Andreas Zeller notes in the book _Why Programs Fail_, the key aspect of scientific debugging is its explicitness: Using the scientific method, you make your assumptions and reasoning explicit, allowing you to understand your assumptions and often reveals hidden clues that can lead to the root cause of the problem on hand. Note: If you'd like to read an excerpt from the book, you can find it on Embedded.com. Scientific Debugging At its core, scientific debugging applies the principles of the scientific method to the process of finding and fixing software defects. Rather than attempting random fixes or relying on intuition, it encourages engineers to move systematically, guided by data, hypotheses, and controlled experimentation. By adopting debugging as a rigorous inquiry, we can reduce guesswork, speed up the resolution process, and ensure that our fixes are based on solid evidence. Just as a scientist begins with a well-defined research question, a software engineer starts by identifying the specific symptom or error condition. For instance, if our users report inconsistencies in the data they see across different parts of the application, our research question could be: _"Under what conditions does the application display outdated or incorrect user data?"_ From there, we can follow a structured debugging process that mirrors the scientific method: - 1. Observe and Define the Problem: First, we need to clearly state the bug's symptoms and the environment in which it occurs. We should isolate whether the issue is deterministic or intermittent and identify any known triggers if possible. Such a structured definition serves as the groundwork for further investigation. - 2. Formulate a Hypothesis: A hypothesis in debugging is a testable explanation for the observed behavior. For instance, you might hypothesize: _"The data inconsistency occurs because a caching layer is serving stale data when certain user profiles are updated."_ The key is that this explanation must be falsifiable; if experiments don't support the hypothesis, it must be refined or discarded. - 3. Collect Evidence and Data: Evidence often includes logs, system metrics, error messages, and runtime traces. Similar to reviewing primary sources in academic research, treat your raw debugging data as crucial evidence. Evaluating these data points can reveal patterns. In our example, such patterns could be whether the bug correlates with specific caching mechanisms, increased memory usage, or database query latency. During this step, it's essential to approach data critically, just as you would analyze the quality and credibility of sources in a research literature review. Don't forget that even logs can be misleading, incomplete, or even incorrect, so cross-referencing multiple sources is key. - 4. Design and Run Experiments: Design minimal, controlled tests to confirm or refute your hypothesis. In our example, you may try disabling or shortening the cache's time-to-live (TTL) to see if more recent data is displayed correctly. By manipulating one variable at a time - such as cache invalidation intervals - you gain clearer insights into causation. Tools such as profilers, debuggers, or specialized test harnesses can help isolate factors and gather precise measurements. - 5. Analyze Results and Refine Hypotheses: If the experiment's outcome doesn't align with your hypothesis, treat it as a stepping stone, not a dead end. Adjust your explanation, form a new hypothesis, or consider additional variables (for example, whether certain API calls bypass caching). Each iteration should bring you closer to a better understanding of the bug's root cause. Remember, the goal is not to prove an initial guess right but to arrive at a verifiable explanation. - 6. Implement and Verify the Fix: Once you're confident in the identified cause, you can implement the fix. Verification doesn't stop at deployment - re-test under the same conditions and, if possible, beyond them. By confirming the fix in a controlled manner, you ensure that the solution is backed by evidence rather than wishful thinking. - Personally, I consider implementing end-to-end tests (e.g., with Playwright) that reproduce the bug and verify the fix to be a crucial part of this step. This both ensures that the bug doesn't reappear in the future due to changes in the codebase and avoids possible imprecisions of manual testing. Now, we can explore these steps in more detail, highlighting how the scientific method can guide us through the debugging process. Establishing Clear Debugging Questions (Formulating a Hypothesis) A hypothesis is a proposed explanation for a phenomenon that can be tested through experimentation. In a debugging context, that phenomenon is the bug or issue you're trying to resolve. Having a clear, falsifiable statement that you can prove or disprove ensures that you stay focused on the real problem rather than jumping haphazardly between possible causes. A properly formulated hypothesis lets you design precise experiments to evaluate whether your explanation holds true. To formulate a hypothesis effectively, you can follow these steps: 1. Clearly Identify the Symptom(s) Before forming any hypothesis, pin down the specific issue users are experiencing. For instance: - "Users intermittently see outdated profile information after updating their accounts." - "Some newly created user profiles don't reflect changes in certain parts of the application." Having a well-defined problem statement keeps your hypothesis focused on the actual issue. Just like a research question in science, the clarity of your symptom definition directly influences the quality of your hypothesis. 2. Draft a Tentative Explanation Next, convert your symptom into a statement that describes a _possible root cause_, such as: - "Data inconsistency occurs because the caching layer isn't invalidating or refreshing user data properly when profiles are updated." - "Stale data is displayed because the cache timeout is too long under certain load conditions." This step makes your assumption about the root cause explicit. As with the scientific method, your hypothesis should be something you can test and either confirm or refute with data or experimentation. 3. Ensure Falsifiability A valid hypothesis must be falsifiable - meaning it can be proven _wrong_. You'll struggle to design meaningful experiments if a hypothesis is too vague or broad. For example: - Not Falsifiable: "Occasionally, the application just shows weird data." - Falsifiable: "Users see stale data when the cache is not invalidated within 30 seconds of profile updates." Making your hypothesis specific enough to fail a test will pave the way for more precise debugging. 4. Align with Available Evidence Match your hypothesis to what you already know - logs, stack traces, metrics, and user reports. For example: - If logs reveal that cache invalidation events aren't firing, form a hypothesis explaining why those events fail or never occur. - If metrics show that data served from the cache is older than the configured TTL, hypothesize about how or why the TTL is being ignored. If your current explanation contradicts existing data, refine your hypothesis until it fits. 5. Plan for Controlled Tests Once you have a testable hypothesis, figure out how you'll attempt to _disprove_ it. This might involve: - Reproducing the environment: Set up a staging/local system that closely mimics production. For instance with the same cache layer configurations. - Varying one condition at a time: For example, only adjust cache invalidation policies or TTLs and then observe how data freshness changes. - Monitoring metrics: In our example, such monitoring would involve tracking user profile updates, cache hits/misses, and response times. These metrics should lead to confirming or rejecting your explanation. These plans become your blueprint for experiments in further debugging stages. Collecting and Evaluating Evidence After formulating a clear, testable hypothesis, the next crucial step is to gather data that can either support or refute it. This mirrors how scientists collect observations in a literature review or initial experiments. 1. Identify "Primary Sources" (Logs, Stack Traces, Code History): - Logs and Stack Traces: These are your direct pieces of evidence - treat them like raw experimental data. For instance, look closely at timestamps, caching-related events (e.g., invalidation triggers), and any error messages related to stale reads. - Code History: Look for related changes in your source control, e.g. using Git bisect. In our example, we would look for changes to caching mechanisms or references to cache libraries in commits, which could pinpoint when the inconsistency was introduced. Sometimes, reverting a commit that altered cache settings helps confirm whether the bug originated there. 2. Corroborate with "Secondary Sources" (Documentation, Q&A Forums): - Documentation: Check official docs for known behavior or configuration details that might differ from your assumptions. - Community Knowledge: Similar issues reported on GitHub or StackOverflow may reveal known pitfalls in a library you're using. 3. Assess Data Quality and Relevance: - Look for Patterns: For instance, does stale data appear only after certain update frequencies or at specific times of day? - Check Environmental Factors: For instance, does the bug happen only with particular deployment setups, container configurations, or memory constraints? - Watch Out for Biases: Avoid seeking only the data that confirms your hypothesis. Look for contradictory logs or metrics that might point to other root causes. You keep your hypothesis grounded in real-world system behavior by treating logs, stack traces, and code history as primary data - akin to raw experimental results. This evidence-first approach reduces guesswork and guides more precise experiments. Designing and Running Experiments With a hypothesis in hand and evidence gathered, it's time to test it through controlled experiments - much like scientists isolate variables to verify or debunk an explanation. 1. Set Up a Reproducible Environment: - Testing Environments: Replicate production conditions as closely as possible. In our example, that would involve ensuring the same caching configuration, library versions, and relevant data sets are in place. - Version Control Branches: Use a dedicated branch to experiment with different settings or configuration, e.g., cache invalidation strategies. This streamlines reverting changes if needed. 2. Control Variables One at a Time: - For instance, if you suspect data inconsistency is tied to cache invalidation events, first adjust only the invalidation timeout and re-test. - Or, if concurrency could be a factor (e.g., multiple requests updating user data simultaneously), test different concurrency levels to see if stale data issues become more pronounced. 3. Measure and Record Outcomes: - Automated Tests: Tests provide a great way to formalize and verify your assumptions. For instance, you could develop tests that intentionally update user profiles and check if the displayed data matches the latest state. - Monitoring Tools: Monitor relevant metrics before, during, and after each experiment. In our example, we might want to track cache hit rates, TTL durations, and query times. - Repeat Trials: Consistency across multiple runs boosts confidence in your findings. 4. Validate Against a Baseline: - If baseline tests manifest normal behavior, but your experimental changes manifest the bug, you've isolated the variable causing the issue. E.g. if the baseline tests show that data is consistently fresh under normal caching conditions but your experimental changes cause stale data. - Conversely, if your change eliminates the buggy behavior, it supports your hypothesis - e.g. that the cache configuration was the root cause. Each experiment outcome is a data point supporting or contradicting your hypothesis. Over time, these data points guide you toward the true cause. Analyzing Results and Iterating In scientific debugging, an unexpected result isn't a failure - it's valuable feedback that brings you closer to the right explanation. 1. Compare Outcomes to the hypothesis. For instance: - Did user data stay consistent after you reduced the cache TTL or fixed invalidation logic? - Did logs show caching events firing as expected, or did they reveal unexpected errors? - Are there only partial improvements that suggest multiple overlapping issues? 2. Incorporate Unexpected Observations: - Sometimes, debugging uncovers side effects - e.g. performance bottlenecks exposed by more frequent cache invalidations. Note these for future work. - If your hypothesis is disproven, revise it. For example, the cache may only be part of the problem, and a separate load balancer setting also needs attention. 3. Avoid Confirmation Bias: - Don't dismiss contrary data. For instance, if you see evidence that updates are fresh in some modules but stale in others, you may have found a more nuanced root cause (e.g., partial cache invalidation). - Consider other credible explanations if your teammates propose them. Test those with the same rigor. 4. Decide If You Need More Data: - If results aren't conclusive, add deeper instrumentation or enable debug modes to capture more detailed logs. - For production-only issues, implement distributed tracing or sampling logs to diagnose real-world usage patterns. 5. Document Each Iteration: - Record the results of each experiment, including any unexpected findings or new hypotheses that arise. - Through iterative experimentation and analysis, each cycle refines your understanding. By letting evidence shape your hypothesis, you ensure that your final conclusion aligns with reality. Implementing and Verifying the Fix Once you've identified the likely culprit - say, a misconfigured or missing cache invalidation policy - the next step is to implement a fix and verify its resilience. 1. Implementing the Change: - Scoped Changes: Adjust just the component pinpointed in your experiments. Avoid large-scale refactoring that might introduce other issues. - Code Reviews: Peer reviews can catch overlooked logic gaps or confirm that your changes align with best practices. 2. Regression Testing: - Re-run the same experiments that initially exposed the issue. In our stale data example, confirm that the data remains fresh under various conditions. - Conduct broader tests - like integration or end-to-end tests - to ensure no new bugs are introduced. 3. Monitoring in Production: - Even with positive test results, real-world scenarios can differ. Monitor logs and metrics (e.g. cache hit rates, user error reports) closely post-deployment. - If the buggy behavior reappears, revisit your hypothesis or consider additional factors, such as unpredicted user behavior. 4. Benchmarking and Performance Checks (If Relevant): - When making changes that affect the frequency of certain processes - such as how often a cache is refreshed - be sure to measure the performance impact. Verify you meet any latency or resource usage requirements. - Keep an eye on the trade-offs: For instance, more frequent cache invalidations might solve stale data but could also raise system load. By systematically verifying your fix - similar to confirming experimental results in research - you ensure that you've addressed the true cause and maintained overall software stability. Documenting the Debugging Process Good science relies on transparency, and so does effective debugging. Thorough documentation guarantees your findings are reproducible and valuable to future team members. 1. Record Your Hypothesis and Experiments: - Keep a concise log of your main hypothesis, the tests you performed, and the outcomes. - A simple markdown file within the repo can capture critical insights without being cumbersome. 2. Highlight Key Evidence and Observations: - Note the logs or metrics that were most instrumental - e.g., seeing repeated stale cache hits 10 minutes after updates. - Document any edge cases discovered along the way. 3. List Follow-Up Actions or Potential Risks: - If you discover additional issues - like memory spikes from more frequent invalidation - note them for future sprints. - Identify parts of the code that might need deeper testing or refactoring to prevent similar issues. 4. Share with Your Team: - Publish your debugging report on an internal wiki or ticket system. A well-documented troubleshooting narrative helps educate other developers. - Encouraging open discussion of the debugging process fosters a culture of continuous learning and collaboration. By paralleling scientific publication practices in your documentation, you establish a knowledge base to guide future debugging efforts and accelerate collective problem-solving. Conclusion Debugging can be as much a rigorous, methodical exercise as an art shaped by intuition and experience. By adopting the principles of scientific inquiry - forming hypotheses, designing controlled experiments, gathering evidence, and transparently documenting your process - you make your debugging approach both systematic and repeatable. The explicitness and structure of scientific debugging offer several benefits: - Better Root-Cause Discovery: Structured, hypothesis-driven debugging sheds light on the _true_ underlying factors causing defects rather than simply masking symptoms. - Informed Decisions: Data and evidence lead the way, minimizing guesswork and reducing the chance of reintroducing similar issues. - Knowledge Sharing: As in scientific research, detailed documentation of methods and outcomes helps others learn from your process and fosters a collaborative culture. Ultimately, whether you are diagnosing an intermittent crash or chasing elusive performance bottlenecks, scientific debugging brings clarity and objectivity to your workflow. By aligning your debugging practices with the scientific method, you build confidence in your solutions and empower your team to tackle complex software challenges with precision and reliability. But most importantly, do not get discouraged by the number of rigorous steps outlined above or by the fact you won't always manage to follow them all religiously. Debugging is a complex and often frustrating process, and it's okay to rely on your intuition and experience when needed. Feel free to adapt the debugging process to your needs and constraints, and as long as you keep the scientific mindset at heart, you'll be on the right track....

Let's innovate together!

We're ready to be your trusted technical partners in your digital innovation journey.

Whether it's modernization or custom software solutions, our team of experts can guide you through best practices and how to build scalable, performant software that lasts.

Prefer email? hi@thisdot.co