Skip to content

Debugging Strategies for Angular Applications

When programming, a lot of time is spent reading and debugging code. When coming to grips with a new framework or library, it is important to know how to debug it when things eventually go astray. Angular has a plethora of useful 1st party and 3rd party tools that will aid you in debugging your application effectively.

Angular Devtools

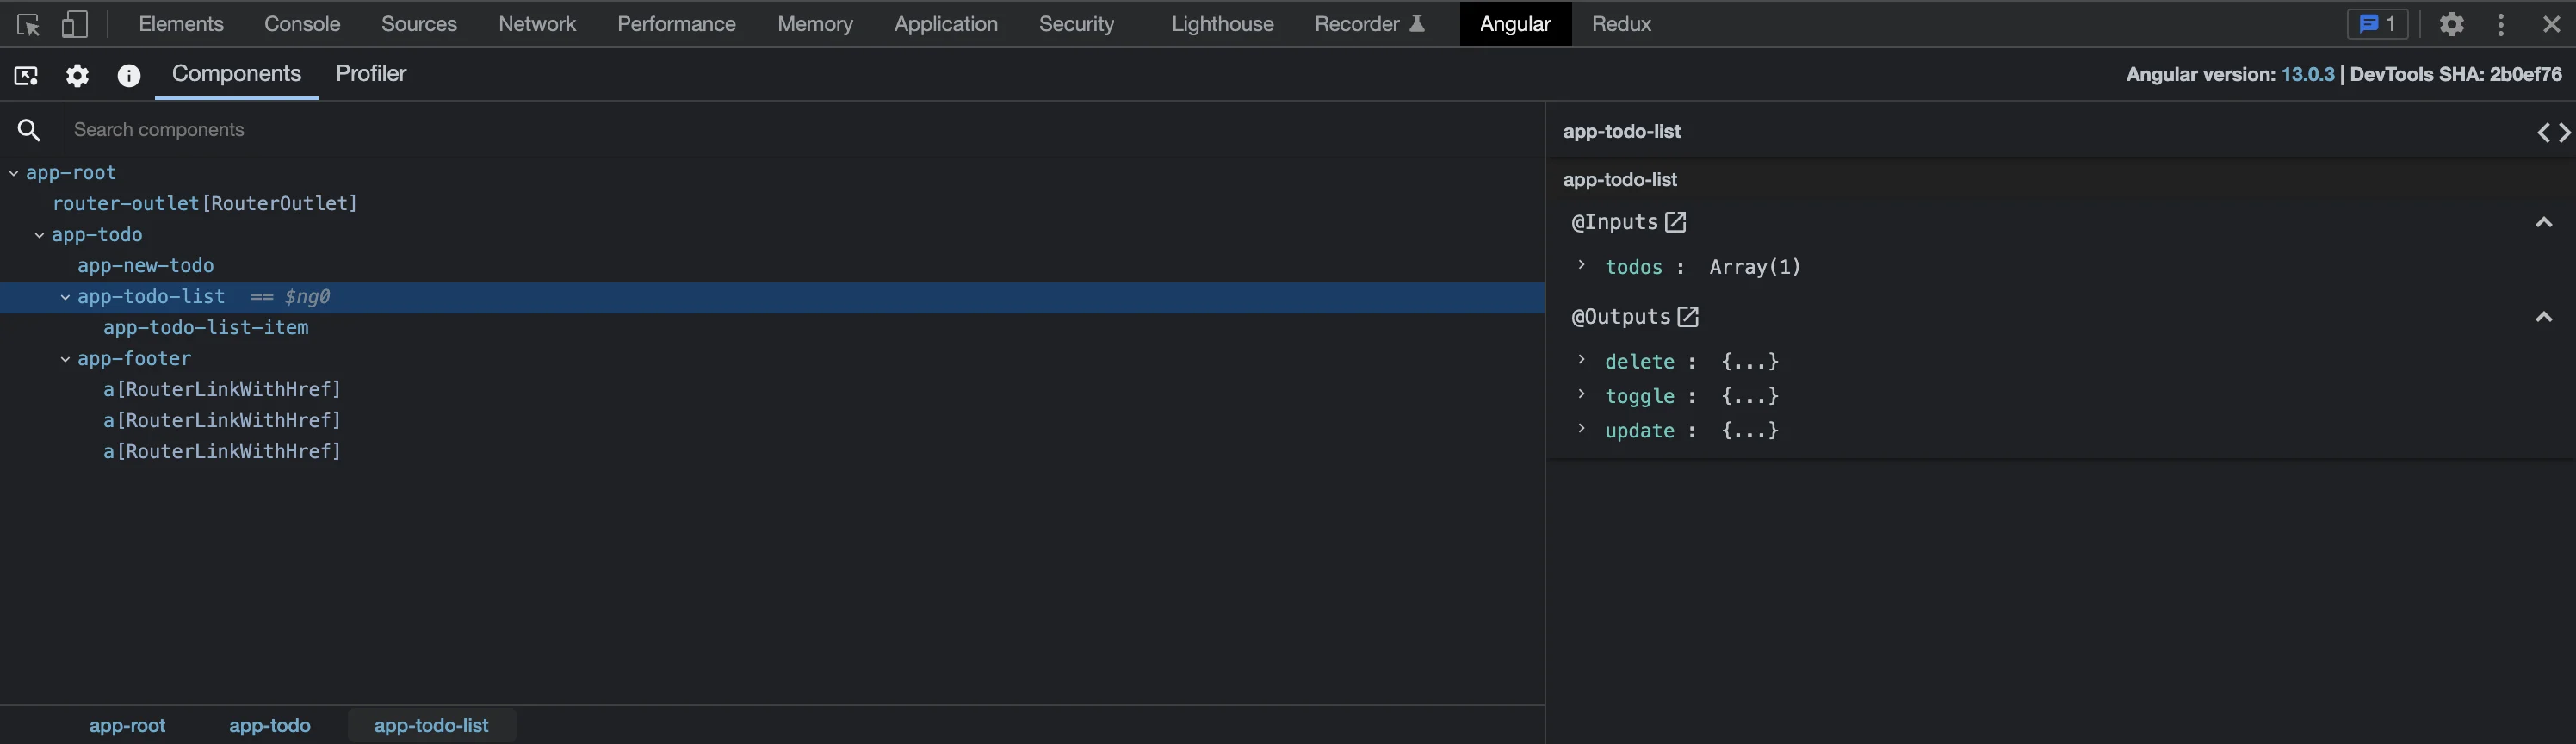
First thing’s first, if you don’t have the Angular Devtools already, then you should download them. The Angular Devtools does many things such as allowing you to view the component tree live as your application runs, view the state of components in your application, and profile your application.

Below, I have an Angular application loaded, and I can view the internal state and configuration of the various components present.

Angular Devtools Screenshot

There is also a “Profiler” tab that can be used for measuring the performance of your individual components. You may ask what performance profiling has to do with debugging. Performance issues are problematic like any bug, and can lead to a detrimental user experience. Being able to identify these issues will make it easier for you to fix these issues, and improve the application.

The profiler gives us a breakdown of the resources used by each component. This is very useful for identifying performance bottlenecks in your application.

One last thing I should mention is the ability to jump to the source code of the component you currently have selected. The button looks like a pair of angle brackets in the top-right corner. This is useful if you need to use the built-in debugger provided by the browser. I highly recommend reading up on the official guide for Angular Devtools, which goes more in-depth about the various features.

Using a JavaScript Debugger

Do not forget that your browser has a built-in debugger. Angular application dev builds are very debuggable as source maps are provided by webpack. If you’re using the Angular CLI for your developer server, then you should already be good to go!

You can access your source code through the “Sources” tab, and it will be available under the “webpack://” dropdown. However, it isn’t very convenient to navigate your source code like this. Instead, you can search for your TypeScript files using CTRL+P (or CMD+P on mac), or use the Angular Devtools to jump to the source code of your components.

Once you’re in the source file, you can place breakpoints directly in your TypeScript files! Do note that debugging the original TypeScript files is not available in production builds.

Screenshot of a JavaScript Debugger with a Breakpoint

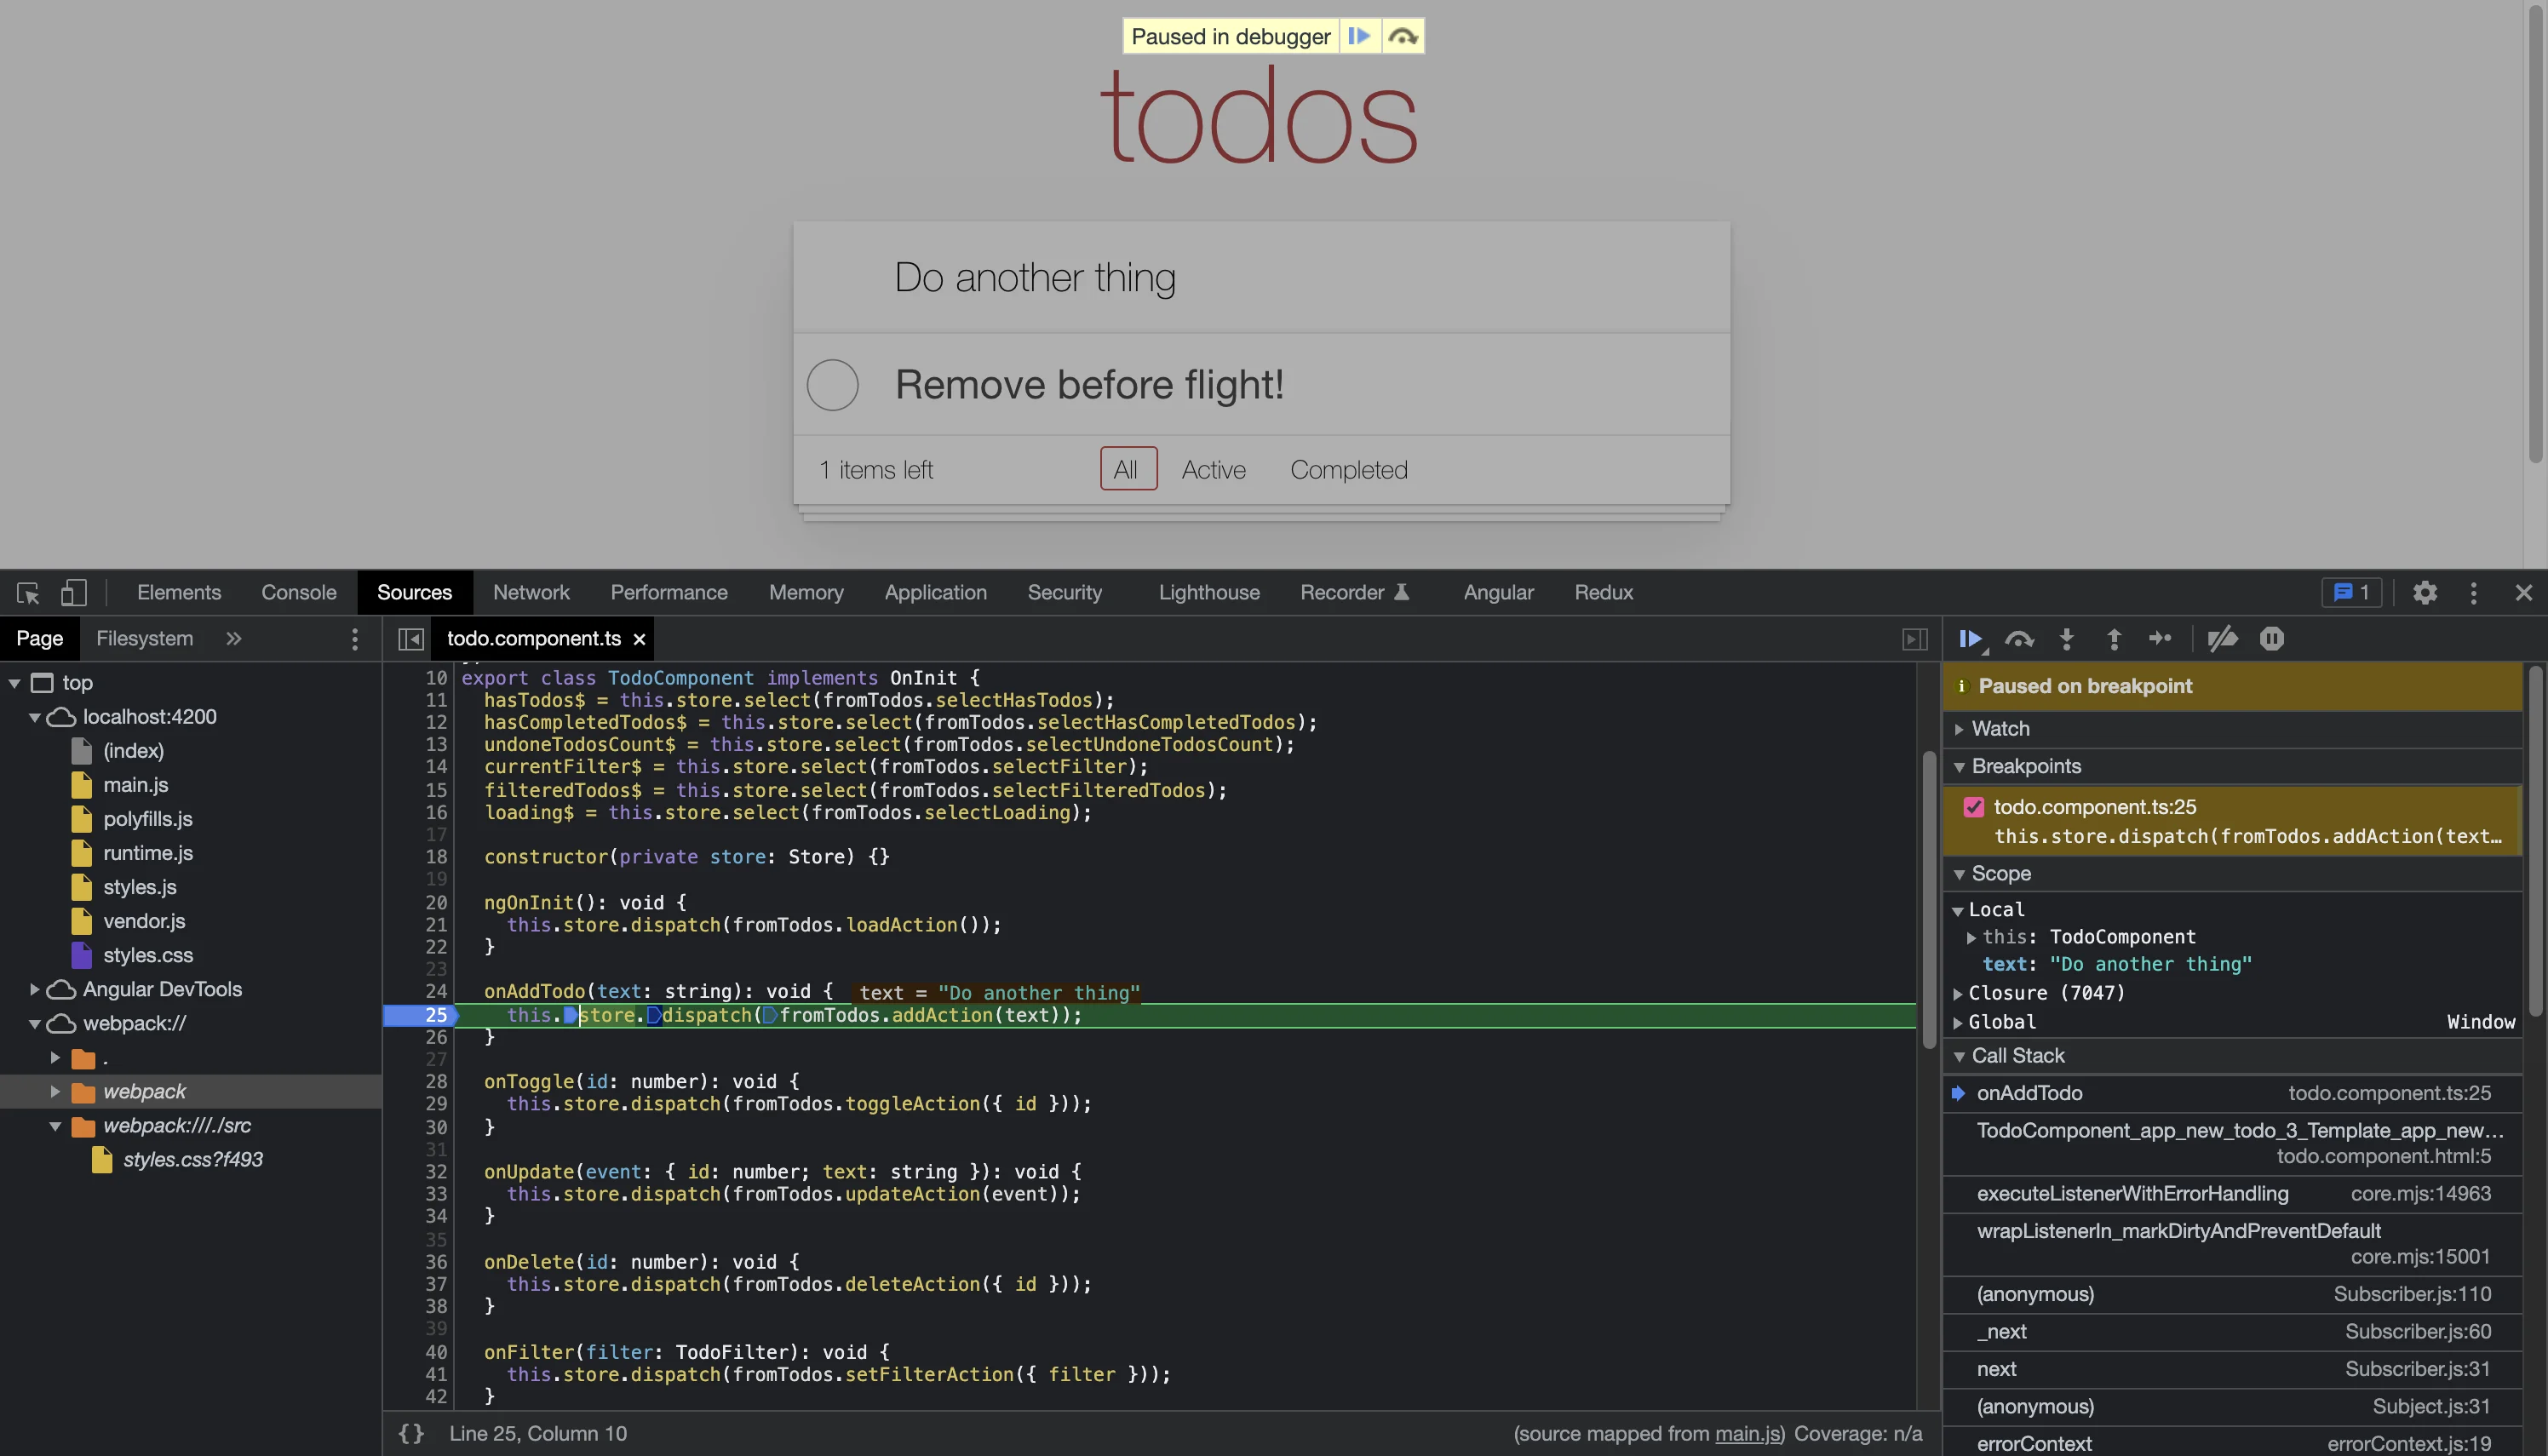
You should try to use the debugger over “console.log” in most situations. It will be much easier to view the state of your application here, and understand what is going on.

Redux Devtools

Lots of Angular applications are using NgRx for state management now. One important thing to keep in mind is that NgRx is compatible with the Redux devtools browser extension. Although NgRx is not based on Redux, that does not stop it from being compatible with its developer tools! Isn’t that neat?

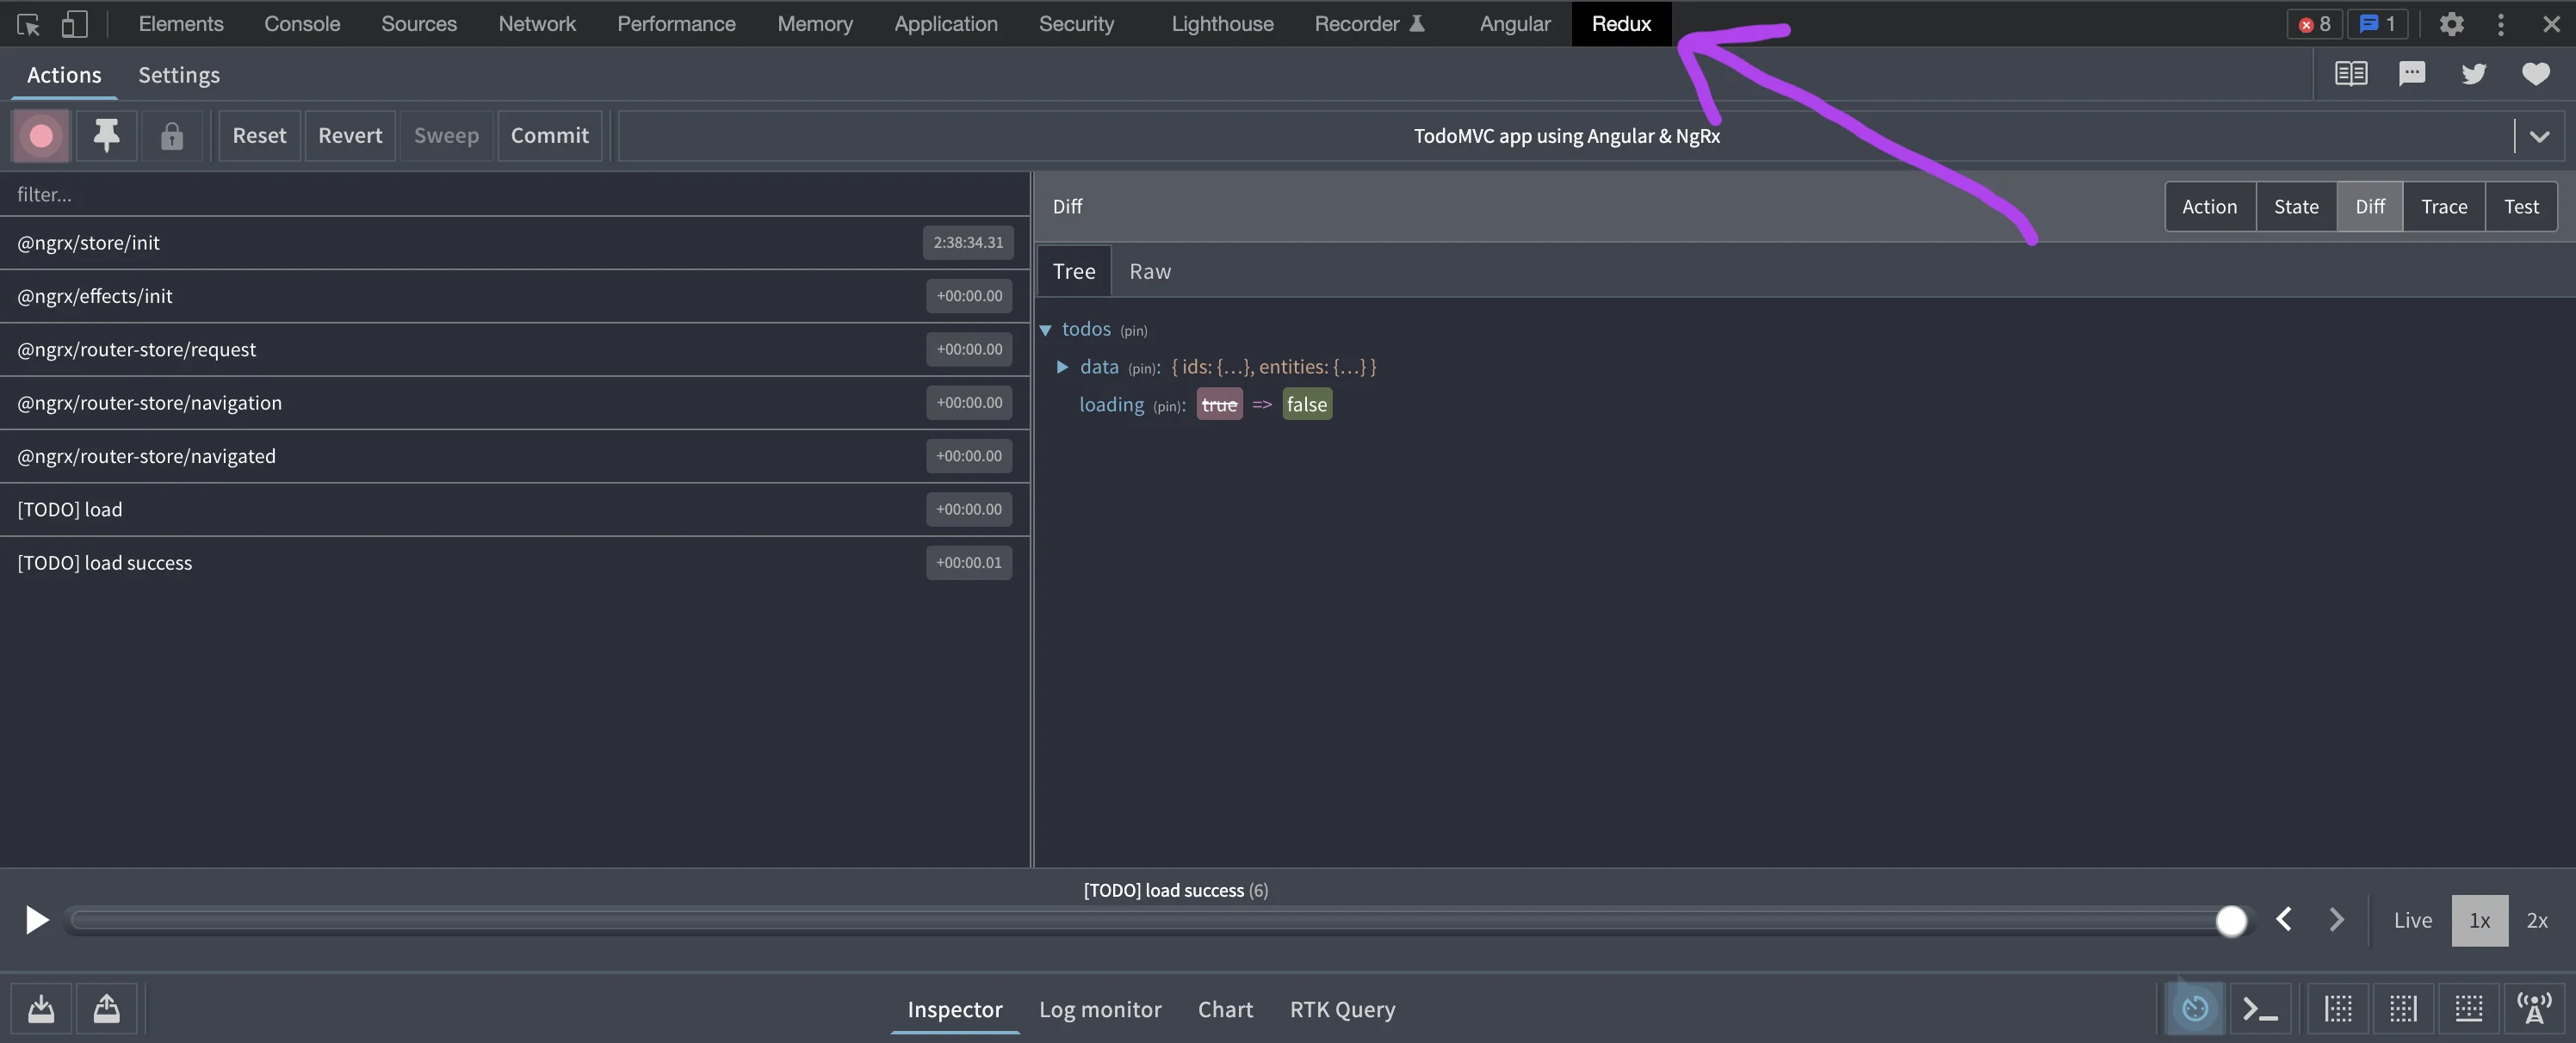
You can install the Redux devtools from your browser’s respective extension marketplace. Once it’s installed, you should see a new tab when you open devtools (F12). Here, you can see I have loaded up a demo application that uses Redux, and the tools appear to be working!

Screenshot Demonstrating NgRx State Changes in Redux Devtools

Before we dig in deeper, I should mention that the application has to do some extra setup to ensure that Redux Devtools works. Out of the box, your application will not work with Redux Devtools until you import the StoreDevTools module. That can easily be done by adding another import to your module.ts file.

@NgModule({
  // Properties...
  imports: [
    // Other imports...
    EffectsModule.forRoot([TodosEffects]),
    !environment.production
      ? StoreDevtoolsModule.instrument({
          name: 'TodoMVC app using Angular & NgRx',
          maxAge: 50,
        })
      : [],
  ],
  // Properties...
})
export class AppModule {}

There are a few things to describe on this screen. Let’s talk about the left sidebar. It is here that you will find a list of actions that have been emitted throughout the lifetime of the application. The first 5 actions are emitted by NgRx after performing initialization of the store and the router. Everything after those are from the application code for the particular example we’re using.

Clicking on one of the actions and having the “Diff” view action on the right-hand side will show what state was changed by it. In the TODO MVC example I used, there are two actions that happen upon initialization. The first just updates a loading flag to true. Then, the second one adds the TODO entries and flips the loading flag back to false.

Screenshot Demonstrating an NgRx State Change

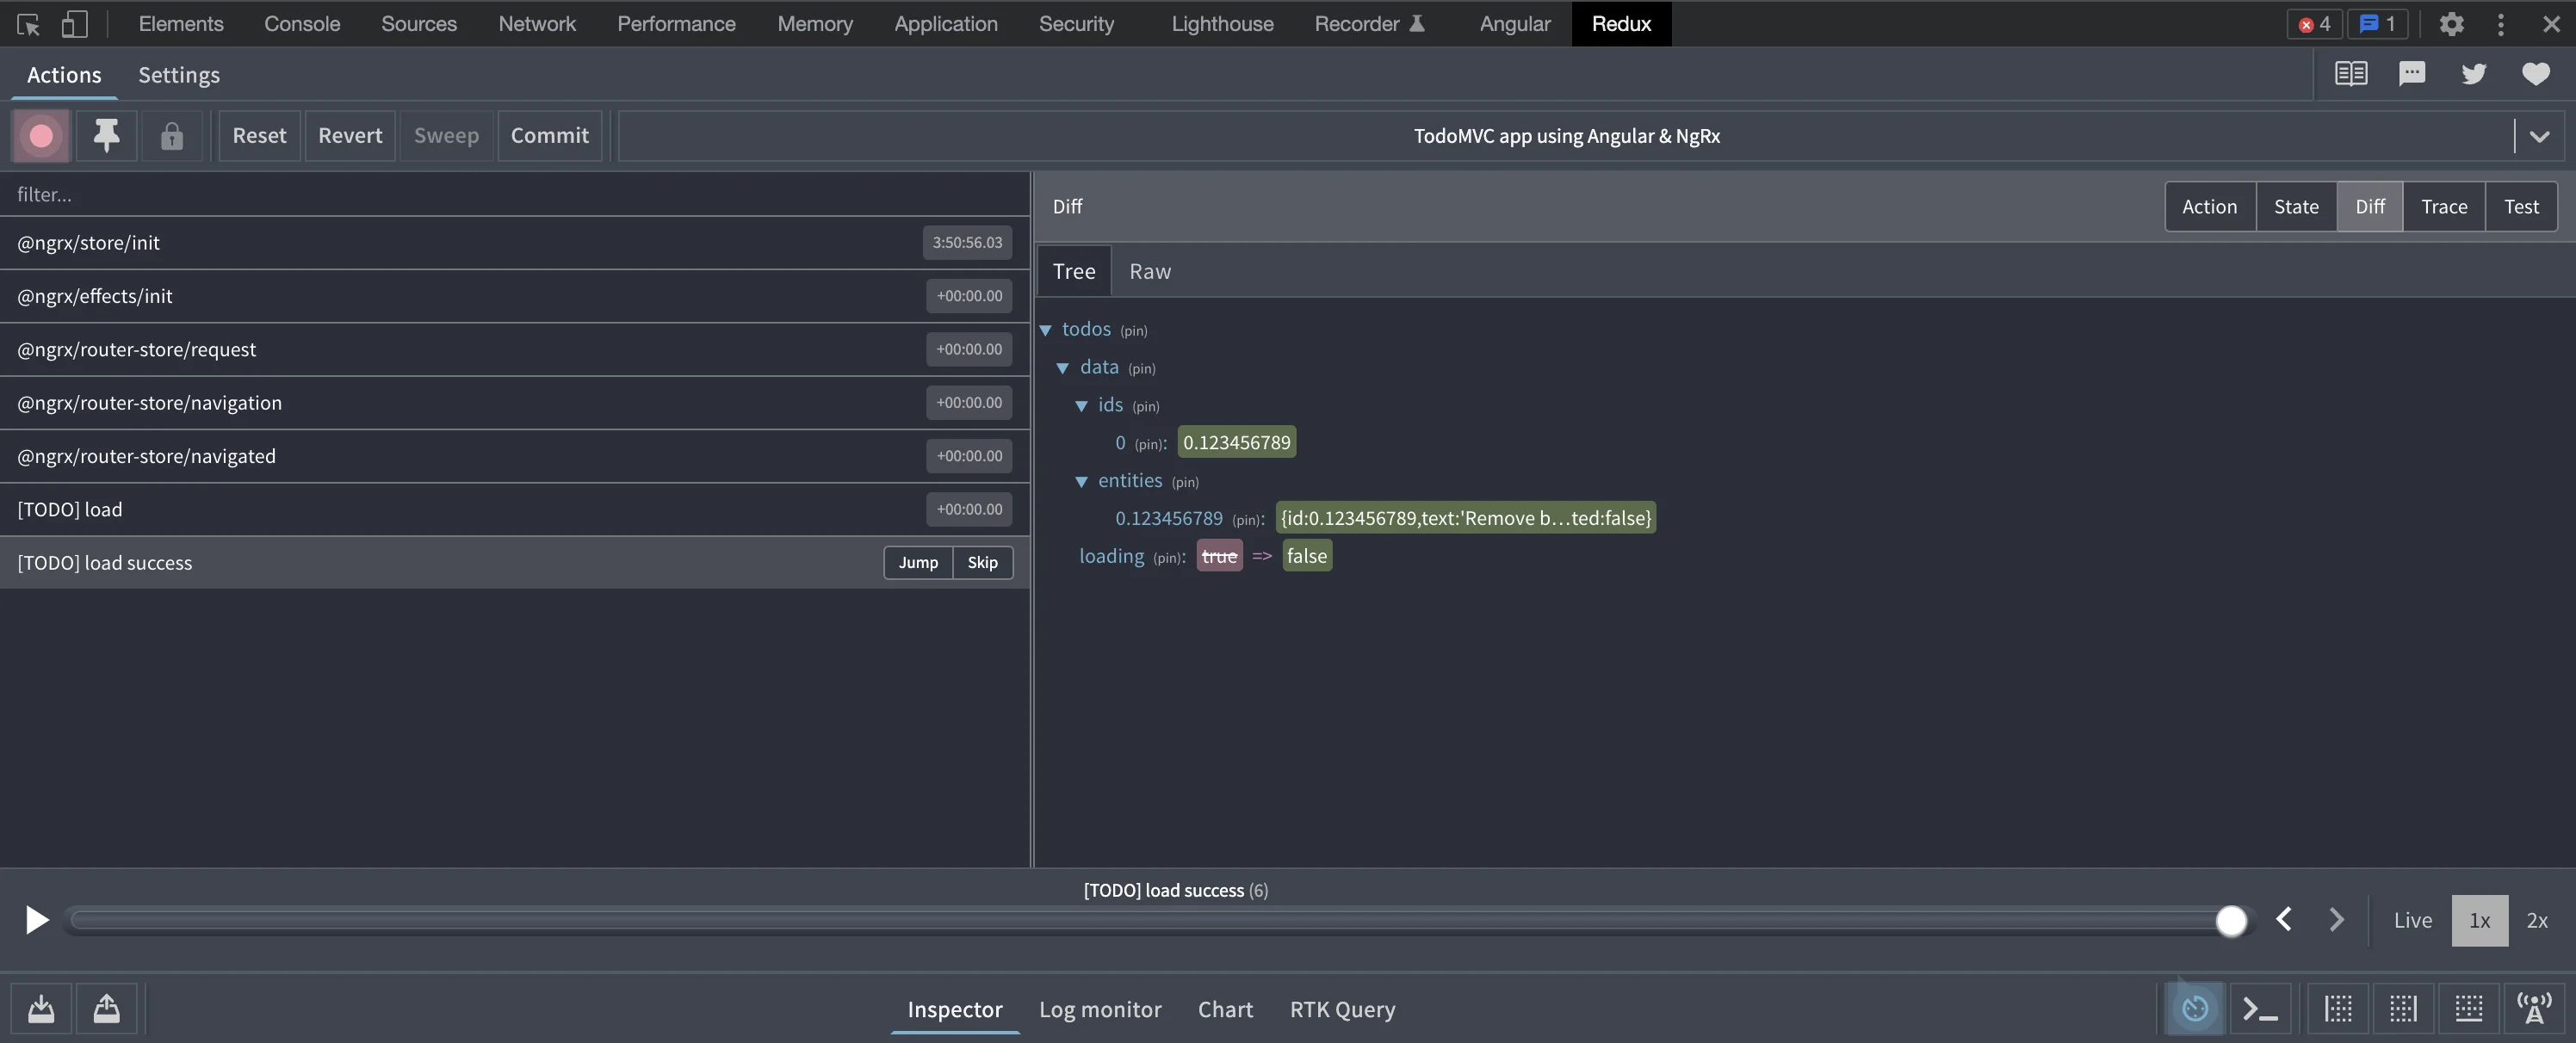
You can also view the contents of individual actions through “Action”, the overall state at that point in time with “State”, generate Jest tests that replay the creation of the state with “Test”, and use “Trace” to find the callstack of whatever triggered the action in the first place. The trace tab in-particular, can be very helpful if an action is being emitted unexpectedly, and you want to figure out why.

I did all of this analysis against the todomvc-angular-ngrx repository if you want to try using the Redux devtools for yourself. We have only glossed the surface of the Redux Devtools here, and I could write a whole article about this wonderful piece of software, but we already did that! If you want to learn more, please consider reading our more in-depth article, Developer Tools & Debugging in NgRx.

Using ng.profiler for Identifying Change Detection Issues

We’ve already gone over the Angular Devtools profiler, but there is another tool provided by Angular that we can use for identifying performance issues related to change detection. For the uninitiated, change detection is the mechanism by which Angular checks for changes to your application’s state, and re-renders views when it does happen. Sometimes, change detection may cause performance issues in larger applications, and one easy way to find out if this is harming it is to use ng.profiler.

ng.profiler can be run on the browser’s console once it is enabled. To enable it, you must call “enableDebugTools” after your app module is finished initializing. I recommend only doing this for dev builds.

platformBrowserDynamic()
  .bootstrapModule(AppModule)
  .then(moduleRef => {
    if (!environment.production) {
          const applicationRef = moduleRef.injector.get(ApplicationRef);
          const componentRef = applicationRef.components[0];
          // Ensure that `ng.profiler` exists.
          enableDebugTools(componentRef);
    }
  })
  .catch(err => console.error(err));

With this code in “main.ts”, we can now use ng.profiler.

Using ng.profiler.timeChangeDetection

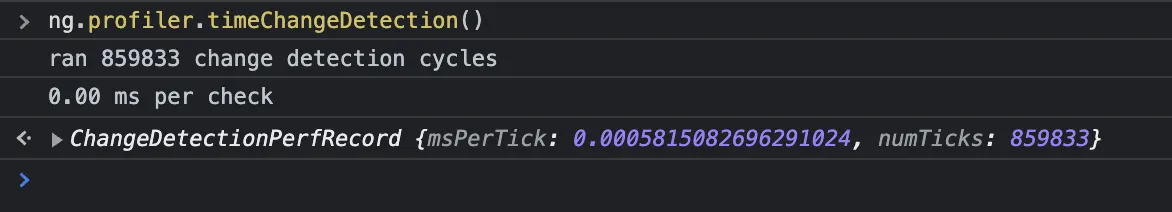
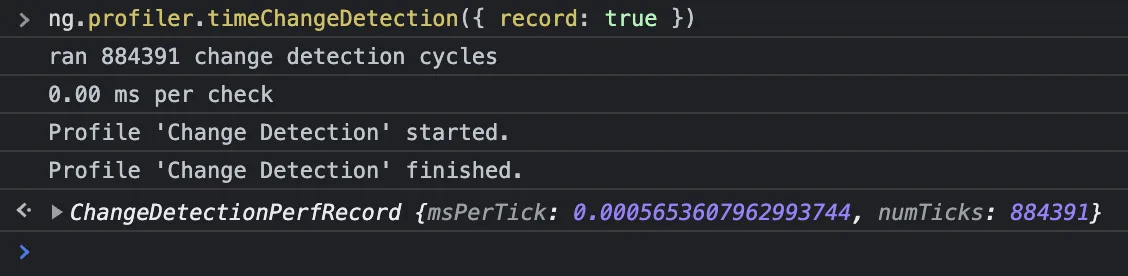
Hurray, it works! As you can see, there’s no problem with change detection in our current view of the application. If there is a problem however, there is an extra option that you can specify to get more fine-grained details. Pass the “record” option into ng.profiler like so.

Using ng.profiler.timeChangeDetection with the "record" Flag Set to "true"

To view the results of the profiling we must ensure that the JavaScript Profiler is enabled (note: this is Chrome specific). You can enable this feature via the Devtools Hamburger Menu > More Tools > JavaScript Profiler.

Screenshot Showing Where to Find the JavaScript Profiler View

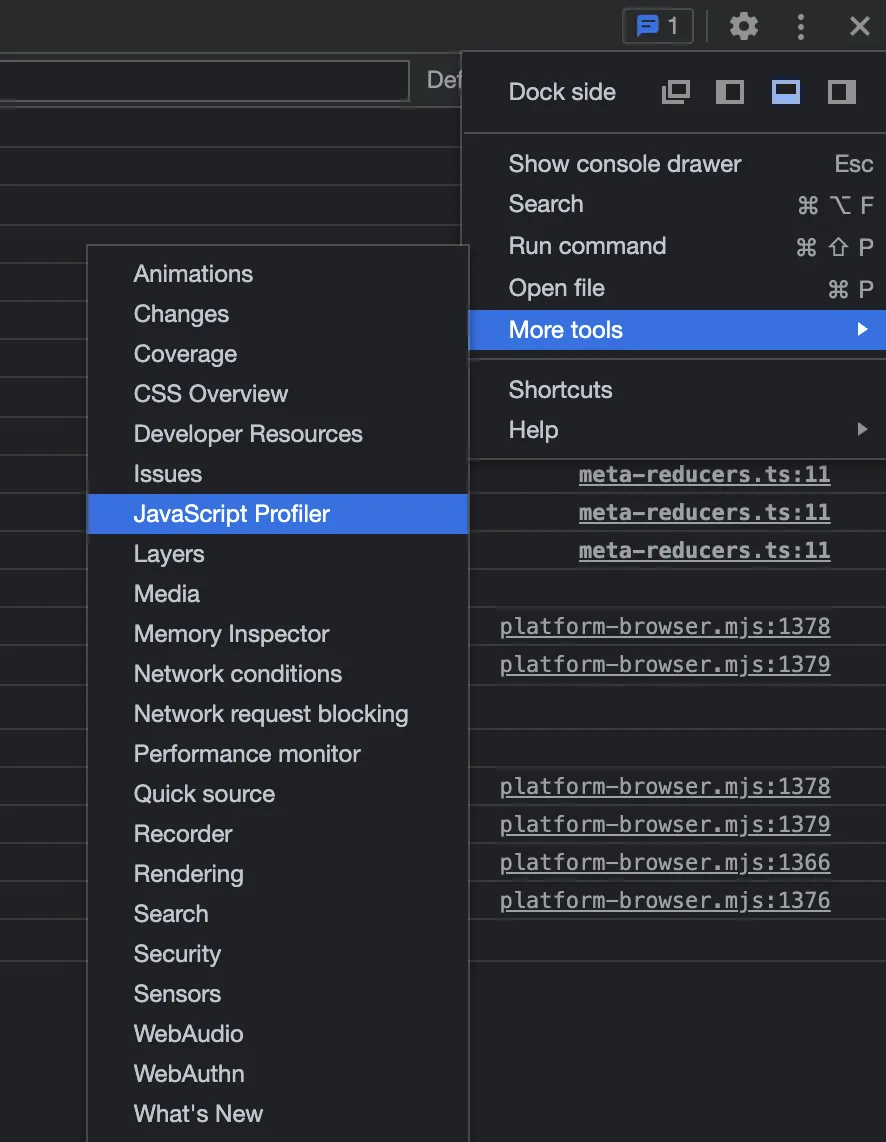
Once that’s enabled, you should have a new “JavaScript Profiler” tab that contains your results!

Screenshot of JavaScript Profiler Results

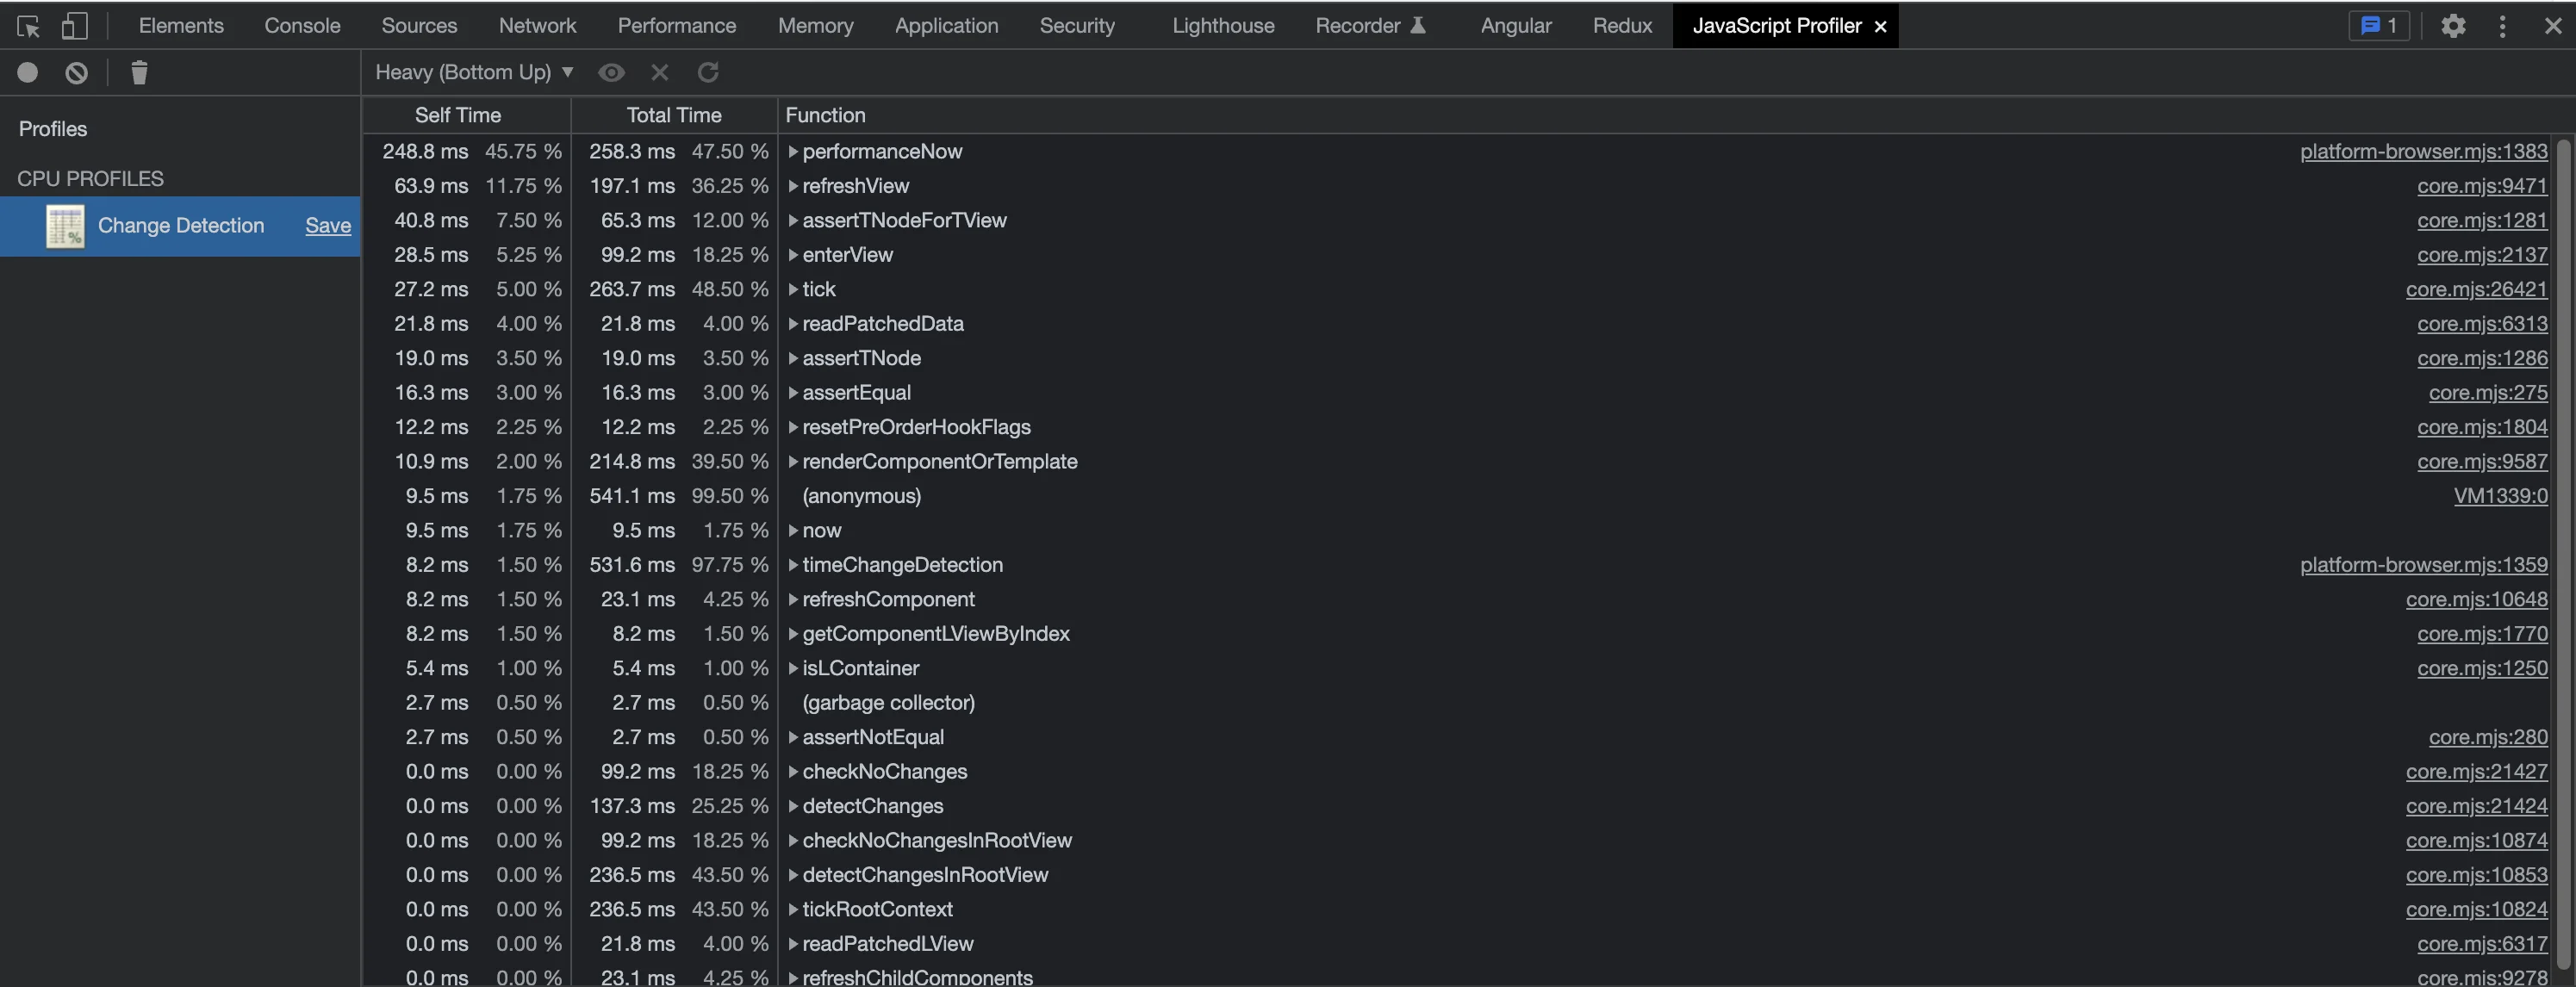
This may look a little intimidating because you will see a lot of results for functions that you don’t have direct control over. Essentially, this is a breakdown of the amount of time it takes for functions in your project to execute. You can sort by total time spent to identify bottlenecks being caused by JavaScript execution as a result of change detection being triggered.

Since the code in my example is fairly minimal, you’re only going to see function calls from the libraries we are using. In a heavier real-world application, you will likely see references to functions in your own application if they’re doing a lot of work on the CPU.

Conclusion

When encountering difficult bugs, whether they’re performance related or otherwise, it helps to know what tools are at your disposal. I hope this information proves useful in your future bug hunts!

This Dot Labs is a development consultancy that is trusted by top industry companies, including Stripe, Xero, Wikimedia, Docusign, and Twilio. This Dot takes a hands-on approach by providing tailored development strategies to help you approach your most pressing challenges with clarity and confidence. Whether it's bridging the gap between business and technology or modernizing legacy systems, you’ll find a breadth of experience and knowledge you need. Check out how This Dot Labs can empower your tech journey.

You might also like

Drizzle ORM: A performant and type-safe alternative to Prisma cover image

Drizzle ORM: A performant and type-safe alternative to Prisma

Introduction I’ve written an article about a similar, more well-known TypeScript ORM named Prisma in the past. While it is a fantastic library that I’ve used and have had success with personally, I noted a couple things in particular that I didn’t love about it. Specifically, how it handles relations with add-on queries and also its bulk that can slow down requests in Lambda and other similar serverless environments. Because of these reasons, I took notice of a newer player in the TypeScript ORM space named Drizzle pretty quickly. The first thing that I noticed about Drizzle and really liked is that even though they call it an ‘ORM’ it’s more of a type-safe query builder. It reminds me of a JS query builder library called ‘Knex’ that I used to use years ago. It also feels like the non-futuristic version of EdgeDB which is another technology that I’m pretty excited about, but committing to it still feels like a gamble at this stage in its development. In contrast to Prisma, Drizzle is a ‘thin TypeScript layer on top of SQL’. This by default should make it a better candidate for Lambda’s and other Serverless environments. It could also be a hard sell to Prisma regulars that are living their best life using the incredibly developer-friendly TypeScript API’s that it generates from their schema.prisma files. Fret not, despite its query-builder roots, Drizzle has some tricks up its sleeve. Let’s compare a common query example where we fetch a list of posts and all of it’s comments from the Drizzle docs: ` // Drizzle query const posts = await db.query.posts.findMany({ with: { comments: true, }, }); // Prisma query const posts = await prisma.post.findMany({ include: { comments: true, }, }); ` Sweet, it’s literally the same thing. Maybe not that hard of a sale after all. You will certainly find some differences in their APIs, but they are both well-designed and developer friendly in my opinion. The schema Similar to Prisma, you define a schema for your database in Drizzle. That’s pretty much where the similarities end. In Drizzle, you define your schema in TypeScript files. Instead of generating an API based off of this schema, Drizzle just infers the types for you, and uses them with their TypeScript API to give you all of the nice type completions and things we’re used to in TypeScript land. Here’s an example from the docs: ` import { integer, pgEnum, pgTable, serial, uniqueIndex, varchar } from 'drizzle-orm/pg-core'; // declaring enum in database export const popularityEnum = pgEnum('popularity', ['unknown', 'known', 'popular']); export const countries = pgTable('countries', { id: serial('id').primaryKey(), name: varchar('name', { length: 256 }), }, (countries) => { return { nameIndex: uniqueIndex('nameidx').on(countries.name), } }); export const cities = pgTable('cities', { id: serial('id').primaryKey(), name: varchar('name', { length: 256 }), countryId: integer('countryid').references(() => countries.id), popularity: popularityEnum('popularity'), }); ` I’ll admit, this feels a bit clunky compared to a Prisma schema definition. The trade-off for a lightweight TypeScript API to work with your database can be worth the up-front investment though. Migrations Migrations are an important piece of the puzzle when it comes to managing our applications databases. Database schemas change throughout the lifetime of an application, and the steps to accomplish these changes is a non-trivial problem. Prisma and other popular ORMs offer a CLI tool to manage and automate your migrations, and Drizzle is no different. After creating new migrations, all that is left to do is run them. Drizzle gives you the flexibility to run your migrations in any way you choose. The simplest of the bunch and the one that is recommended for development and prototyping is the drizzle-kit push command that is similar to the prisma db push command if you are familiar with it. You also have the option of running the .sql files directly or using the Drizzle API's migrate function to run them in your application code. Drizzle Kit is a companion CLI tool for managing migrations. Creating your migrations with drizzle-kit is as simple as updating your Drizzle schema. After making some changes to your schema, you run the drizzle-kit generate command and it will generate a migration in the form of a .sql file filled with the needed SQL commands to migrate your database from point a → point b. Performance When it comes to your database, performance is always an extremely important consideration. In my opinion this is the category that really sets Drizzle apart from similar competitors. SQL Focused Tools like Prisma have made sacrifices and trade-offs in their APIs in an attempt to be as database agnostic as possible. Drizzle gives itself an advantage by staying focused on similar SQL dialects. Serverless Environments Serverless environments are where you can expect the most impactful performance gains using Drizzle compared to Prisma. Prisma happens to have a lot of content that you can find on this topic specifically, but the problem stems from cold starts in certain serverless environments like AWS Lambda. With Drizzle being such a lightweight solution, the time required to load and execute a serverless function or Lambda will be much quicker than Prisma. Benchmarks You can find quite a few different open-sourced benchmarks of common database drivers and ORMs in JavaScript land. Drizzle maintains their own benchmarks on GitHub. You should always do your own due diligence when it comes to benchmarks and also consider the inputs and context. In Drizzle's own benchmarks, it’s orders of magnitudes faster when compared to Prisma or TypeORM, and it’s not far off from the performance you would achieve using the database drivers directly. This would make sense considering the API adds almost no overhead, and if you really want to achieve driver level performance, you can utilize the prepared statements API. Prepared Statements The prepared statements API in Drizzle allows you to pre-generate raw queries that get sent directly to the underlying database driver. This can have a very significant impact on performance, especially when it comes to larger, more complex queries. Prepared statements can also provide huge performance gains when used in serverless environments because they can be cached and reused. JOINs I mentioned at the beginning of this article that one of the things that bothered me about Prisma is the fact that fetching relations on queries generates additional sub queries instead of utilizing JOINs. SQL databases are relational, so using JOINs to include data from another table in your query is a core and fundamental part of how the technology is supposed to work. The Drizzle API has methods for every type of JOIN statement. Properly using JOINs instead of running a bunch of additional queries is an important way to get better performance out of your queries. This is a huge selling point of Drizzle for me personally. Other bells and whistles Drizzle Studio UIs for managing the contents of your database are all the rage these days. You’ve got Prisma Studio and EdgeDB UI to name a couple. It's no surprise that these are so popular. They provide a lot of value by letting you work with your database visually. Drizzle also offers Drizzle Studio and it’s pretty similar to Prisma Studio. Other notable features - Raw Queries - The ‘magic’ sql operator is available to write raw queries using template strings. - Transactions - Transactions are a very common and important feature in just about any database tools. It’s commonly used for seeding or if you need to write some other sort of manual migration script. - Schemas - Schemas are a feature specifically for Postgres and MySQL database dialects - Views -Views allow you to encapsulate the details of the structure of your tables, which might change as your application evolves, behind consistent interfaces. - Logging - There are some logging utilities included useful for debugging, benchmarking, and viewing generated queries. - Introspection - There are APIs for introspecting your database and tables - Zod schema generation - This feature is available in a companion package called drizzle-zod that will generate Zod schema’s based on your Drizzle tables Seeding At the time of this writing, I’m not aware of Drizzle offering any tools or specific advice on seeding your database. I assume this is because of how straightforward it is to handle this on your own. If I was building a new application I would probably provide a simple seed script in JS or TS and use a runtime like node to execute it. After that, you can easily add a command to your package.json and work it into your CI/CD setup or anything else. Conclusion Drizzle ORM is a performant and type-safe alternative to Prisma. While Prisma is a fantastic library, Drizzle offers some advantages such as a lightweight TypeScript API, a focus on SQL dialects, and the ability to use JOINs instead of generating additional sub queries. Drizzle also offers Drizzle Studio for managing the contents of your database visually, as well as other notable features such as raw queries, transactions, schemas, views, logging, introspection, and Zod schema generation. While Drizzle may require a bit more up-front investment in defining your schema, it can be worth it for the performance gains, especially in serverless environments....

Nuxt DevTools v1.0: Redefining the Developer Experience Beyond Conventional Tools cover image

Nuxt DevTools v1.0: Redefining the Developer Experience Beyond Conventional Tools

In the ever-evolving world of web development, Nuxt.js has taken a monumental leap with the launch of Nuxt DevTools v1.0. More than just a set of tools, it's a game-changer—a faithful companion for developers. This groundbreaking release, available for all Nuxt projects and being defaulted from Nuxt v3.8 onwards, marks the beginning of a new era in developer tools. It's designed to simplify our development journey, offering unparalleled transparency, performance, and ease of use. Join me as we explore how Nuxt DevTools v1.0 is set to revolutionize our workflow, making development faster and more efficient than ever. What makes Nuxt DevTools so unique? Alright, let's start delving into the features that make this tool so amazing and unique. There are a lot, so buckle up! In-App DevTools The first thing that caught my attention is that breaking away from traditional browser extensions, Nuxt DevTools v1.0 is seamlessly integrated within your Nuxt app. This ensures universal compatibility across browsers and devices, offering a more stable and consistent development experience. This setup also means the tools are readily available in the app, making your work more efficient. It's a smart move from the usual browser extensions, making it a notable highlight. To use it you just need to press Shift + Option + D` (macOS) or `Shift + Alt + D` (Windows): With simple keystrokes, the Nuxt DevTools v1.0 springs to life directly within your app, ready for action. This integration eliminates the need to toggle between windows or panels, keeping your workflow streamlined and focused. The tools are not only easily accessible but also intelligently designed to enhance your productivity. Pages, Components, and Componsables View The Pages, Components, and Composables View in Nuxt DevTools v1.0 are a clear roadmap for your app. They help you understand how your app is built by simply showing its structure. It's like having a map that makes sense of your app's layout, making the complex parts of your code easier to understand. This is really helpful for new developers learning about the app and experienced developers working on big projects. Pages View lists all your app's pages, making it easier to move around and see how your site is structured. What's impressive is the live update capability. As you explore the DevTools, you can see the changes happening in real-time, giving you instant feedback on your app's behavior. Components View is like a detailed map of all the parts (components) your app uses, showing you how they connect and depend on each other. This helps you keep everything organized, especially in big projects. You can inspect components, change layouts, see their references, and filter them. By showcasing all the auto-imported composables, Nuxt DevTools provides a clear overview of the composables in use, including their source files. This feature brings much-needed clarity to managing composables within large projects. You can also see short descriptions and documentation links in some of them. Together, these features give you a clear picture of your app's layout and workings, simplifying navigation and management. Modules and Static Assets Management This aspect of the DevTools revolutionizes module management. It displays all registered modules, documentation, and repository links, making it easy to discover and install new modules from the community! This makes managing and expanding your app's capabilities more straightforward than ever. On the other hand, handling static assets like images and videos becomes a breeze. The tool allows you to preview and integrate these assets effortlessly within the DevTools environment. These features significantly enhance the ease and efficiency of managing your app's dynamic and static elements. The Runtime Config and Payload Editor The Runtime Config and Payload Editor in Nuxt DevTools make working with your app's settings and data straightforward. The Runtime Config lets you play with different configuration settings in real time, like adjusting settings on the fly and seeing the effects immediately. This is great for fine-tuning your app without guesswork. The Payload Editor is all about managing the data your app handles, especially data passed from server to client. It's like having a direct view and control over the data your app uses and displays. This tool is handy for seeing how changes in data impact your app, making it easier to understand and debug data-related issues. Open Graph Preview The Open Graph Preview in Nuxt DevTools is a feature I find incredibly handy and a real time-saver. It lets you see how your app will appear when shared on social media platforms. This tool is crucial for SEO and social media presence, as it previews the Open Graph tags (like images and descriptions) used when your app is shared. No more deploying first to check if everything looks right – you can now tweak and get instant feedback within the DevTools. This feature not only streamlines the process of optimizing for social media but also ensures your app makes the best possible first impression online. Timeline The Timeline feature in Nuxt DevTools is another standout tool. It lets you track when and how each part of your app (like composables) is called. This is different from typical performance tools because it focuses on the high-level aspects of your app, like navigation events and composable calls, giving you a more practical view of your app's operation. It's particularly useful for understanding the sequence and impact of events and actions in your app, making it easier to spot issues and optimize performance. This timeline view brings a new level of clarity to monitoring your app's behavior in real-time. Production Build Analyzer The Production Build Analyzer feature in Nuxt DevTools v1.0 is like a health check for your app. It looks at your app's final build and shows you how to make it better and faster. Think of it as a doctor for your app, pointing out areas that need improvement and helping you optimize performance. API Playground The API Playground in Nuxt DevTools v1.0 is like a sandbox where you can play and experiment with your app's APIs. It's a space where you can easily test and try out different things without affecting your main app. This makes it a great tool for trying out new ideas or checking how changes might work. Some other cool features Another amazing aspect of Nuxt DevTools is the embedded full-featured VS Code. It's like having your favorite code editor inside the DevTools, with all its powerful features and extensions. It's incredibly convenient for making quick edits or tweaks to your code. Then there's the Component Inspector. Think of it as your code's detective tool. It lets you easily pinpoint and understand which parts of your code are behind specific elements on your page. This makes identifying and editing components a breeze. And remember customization! Nuxt DevTools lets you tweak its UI to suit your style. This means you can set up the tools just how you like them, making your development environment more comfortable and tailored to your preferences. Conclusion In summary, Nuxt DevTools v1.0 marks a revolutionary step in web development, offering a comprehensive suite of features that elevate the entire development process. Features like live updates, easy navigation, and a user-friendly interface enrich the development experience. Each tool within Nuxt DevTools v1.0 is thoughtfully designed to simplify and enhance how developers build and manage their applications. In essence, Nuxt DevTools v1.0 is more than just a toolkit; it's a transformative companion for developers seeking to build high-quality web applications more efficiently and effectively. It represents the future of web development tools, setting new standards in developer experience and productivity....

Git Reflog: A Guide to Recovering Lost Commits cover image

Git Reflog: A Guide to Recovering Lost Commits

Losing data can be very frustrating. Sometimes data is lost because of hardware dying, but other times it’s done by mistake. Thankfully, Git has tools that can assist with the latter case at least. In this article, I will demonstrate how one can use the git-reflog tool to recover lost code and commits. What is Reflog? Whenever you add data to your local Git repository or perform destructive operations, Git keeps track of all these using reference logs, also known as reflogs. These log entries contain a SHA-1 hash of the commit associated with it and any references, or refs for short. Refs themselves are branch names, tags, and symbolic refs like HEAD, which is always pointing to the ref or commit id that’s currently checked out. These reflogs can prove very useful in assisting with data recovery against a Git repository if some code is lost in a destructive operation. Reflog records contain data such as the SHA-1 hash that HEAD was pointing to when an operation was performed, and a description of the operation that was performed as well. Here is an example of what a reflog might look like: ` 956eb2f (HEAD -> branch-prefix/v2-1-4, origin/branch-prefix/v2-1-4) HEAD@{0}: commit: fix: post-rebase errors ` The first part 956eb2f` is the commit hash of the currently checked out commit when this entry was added to the reflog. If a ref currently exists in the repo that points to the commit id, such as the `branch-prefix/v2-1-4` branch in this case, then those refs will be printed alongside the commit id in the reflog entry. It should be noted that the actual refs themselves are not always stored in the entry, but are instead inferred by Git from the commit id in the entry when dumping the reflog. This means that if we were to remove the branch named branch-prefix/v2-1-4`, it would no longer appear in the reflog entry here. There’s also a HEAD` part as well. This just tells us that `HEAD` is currently pointing to the commit id in the entry. If we were to navigate to a different branch such as `main`, then the `HEAD ->` section would disappear from that specific entry. The HEAD@{n}` section is just an index that specifies where `HEAD` was `n` moves ago. In this example, it is zero, which means that is where `HEAD` currently is. Finally what follows is a text description of the operation that was performed. In this case, it was just a commit. Descriptions for supported operations include but are not limited to commit, pull, checkout, reset, rebase, and squash. Basic Usage Running git reflog` with no other arguments or `git reflog show` will give you a list of records that show when the tips of branches and other references in the repository have been updated. It will also be in the order that the operations were done. The output for a fresh repository with an initial commit will look something like this. ` 13deb8e (HEAD -> main) HEAD@{0}: commit (initial): initial commit ` Now let’s create a new branch called feature` with `git switch -c feature` and then commit some changes. Doing this will add a couple of entries to the reflog. One for the checkout of the branch, and one for committing some changes. ` 4f8d10d (HEAD -> feature) HEAD@{0}: commit: more stuff 13deb8e (main) HEAD@{1}: checkout: moving from main to feature 13deb8e (main) HEAD@{2}: commit (initial): initial commit ` This log will continue to grow as we perform more operations that write data to git. A Rebase Gone Wrong Let’s do something slightly more complex. We’re going to make some changes to main and then rebase our feature branch on top of it. This is the current history once a few more commits are added. ` 138afbf (HEAD -> feature) here's some more cb72b26 even more stuff 4f8d10d more stuff 13deb8e initial commit ` And this is what main looks like: ` a84bdfa (HEAD -> main) add other content 13deb8e initial commit ` After doing a git rebase main` while checked into the `feature` branch, let’s say some merge conflicts got resolved incorrectly and some code was accidentally lost. A Git log after doing such a rebase might look something like this. ` be44ab0 (HEAD -> feature) here's some more a84bdfa (main) add other content 13deb8e initial commit ` Fun fact: if the contents of a commit are not used after a rebase between the tip of the branch and the merge base, Git will discard those commits from the active branch after the rebase is concluded. In this example, I entirely discarded the contents of two commits “by mistake”, and this resulted in Git discarding them from the current branch. Alright. So we lost some code from some commits, and in this case, even the commits themselves. So how do we get them back as they’re in neither the main branch nor the feature branch? Reflog to the Rescue Although our commits are inaccessible on all of our branches, Git did not actually delete them. If we look at the output of git reflog`, we will see the following entries detailing all of the changes we’ve made to the repository up till this point: ` be44ab0 (HEAD -> feature) HEAD@{0}: rebase (continue) (finish): returning to refs/heads/feature be44ab0 (HEAD -> feature) HEAD@{1}: rebase (continue): here's some more a84bdfa (main) HEAD@{2}: rebase (start): checkout main 138afbf HEAD@{3}: checkout: moving from main to feature a84bdfa (main) HEAD@{4}: commit: add other content 13deb8e HEAD@{5}: checkout: moving from feature to main 138afbf HEAD@{6}: commit: here's some more cb72b26 HEAD@{7}: commit: even more stuff 4f8d10d HEAD@{8}: commit: more stuff 13deb8e HEAD@{9}: checkout: moving from main to feature 13deb8e HEAD@{10}: commit (initial): initial commit ` This can look like a bit much. But we can see that the latest commit on our feature branch before the rebase reads 138afbf HEAD@{6}: commit: here's some more`. The SHA1 associated with this entry is still being stored in Git and we can get back to it by using git-reset. In this case, we can run git reset --hard 138afbf`. However, `git reset --hard ORIG_HEAD` also works. The `ORIG_HEAD` in the latter command is a special variable that indicates the last place of the HEAD since the last drastic operation, which includes but is not limited to: merging and rebasing. So if we run either of those commands, we’ll get output saying HEAD is now at 138afbf here's some more` and our `git log` for the `feature` branch should look like the following. ` 138afbf (HEAD -> feature) here's some more cb72b26 even more stuff 4f8d10d more stuff 13deb8e initial commit ` Any code that was accidentally removed should now be accessible once again! Now the rebase can be attempted again. Reflog Pruning and Garbage Collection One thing to keep in mind is that the reflog is not permanent. It is subject to garbage collection by Git on occasion. In reality, this isn’t a big deal since most uses of reflog will be against records that were created recently. By default, reflog records are set to expire after 90 days. The duration of this can be controlled via the gc.reflogExpire` key in your git config. Once reflog records are expired, they then become eligible for removal by git-gc. git gc` can be invoked manually, but it usually isn’t. `git pull`, `git merge`, `git rebase` and `git commit` are all examples of commands that will trigger `git gc` to run behind the scenes. I will abstain from going into detail about git gc` as that would be deserving of its own article, but it’s important to know about in the context of `git reflog` as it does have an effect on it. Conclusion git reflog` is a very helpful tool that allows one to recover lost code and commits when used in conjunction with `git reset`. We learned how to use `git reflog` to view changes made to a repository since we’ve cloned it, and to undo a bad rebase to recover some lost commits....

Software Team Leadership: Risk Taking & Decision Making with David Cramer, Co-Founder & CTO at Sentry cover image

Software Team Leadership: Risk Taking & Decision Making with David Cramer, Co-Founder & CTO at Sentry

In this episode of the engineering leadership series, Rob Ocel interviews David Cramer, co-founder and CTO of Sentry, delving into the importance of decision-making, risk-taking, and the challenges faced in the software engineering industry. David emphasizes the significance of having conviction and being willing to make decisions, even if they turn out to be wrong. He shares his experience of attending a CEO event, where he discovered that decision-making and conflict resolution are struggles even for successful individuals. David highlights the importance of making decisions quickly and accepting the associated risks, rather than attempting to pursue multiple options simultaneously. He believes that being decisive is crucial in the fast-paced software engineering industry. This approach allows for faster progress and adaptation, even if it means occasionally making mistakes along the way. The success of Sentry is attributed to a combination of factors, including market opportunity and the team's principles and conviction. David acknowledges that bold ideas often carry a higher risk of failure, but if they do succeed, the outcome can be incredibly significant. This mindset has contributed to Sentry’s achievements in the industry. The interview also touches on the challenges of developing and defending opinions in the software engineering field. David acknowledges that it can be difficult to navigate differing viewpoints and conflicting ideas. However, he emphasizes the importance of standing by one's convictions and being open to constructive criticism and feedback. Throughout the conversation, David emphasizes the need for engineering leaders to be decisive and take calculated risks. He encourages leaders to trust their instincts and make decisions promptly, even if they are uncertain about the outcome. This approach fosters a culture of innovation and progress within engineering teams. The episode provides valuable insights into the decision-making process and the challenges faced by engineering leaders. It highlights the importance of conviction, risk-taking, and the ability to make decisions quickly in the software engineering industry. David's experiences and perspectives offer valuable lessons for aspiring engineering leaders looking to navigate the complexities of the field....