Skip to content

Creating Custom GitHub Actions

This article was written over 18 months ago and may contain information that is out of date. Some content may be relevant but please refer to the relevant official documentation or available resources for the latest information.

Since its generally available release in Nov 2019, Github Actions has seen an incredible increase in adoptions.

Github Actions allows you to automate, customize and execute your software development workflows.

In this article, we will learn how to create our first custom Github Actions using Typescript. We will also show some of the best practices, suggested by Github, for publishing and versioning our actions.

Types of Actions

There two types of publishable actions: Javascript and Docker actions.

Docker containers provide a more consistent and reliable work unit than Javascript actions because they package the environment with the Github Actions code. They are ideal for actions that must run in a specific configuration.

On the other hand, JavaScript actions are faster than Docker actions since they run directly on a runner machine and do not have to worry about building the Docker image every time. Javascript actions can run in Windows, Mac, and Linux, while Docker actions can just run in Linux. But most importantly (for the purpose of this article), Javascript actions are easier to write.

There is a third kind of Action: the Composite run steps Actions. These help you reuse code inside your project workflows, and hide complexity when you do not want to publish the Action to the marketplace.

You can quickly learn how to create Composite run step Actions in this video, or by reading through the docs.

The Action

For this article, we will be creating a simple Javascript Action.

We will use the Typescript Action template to simplify our setup, and use TypeScript out of the box. The objective is to walk over the whole lifecycle of creating and publishing a custom GitHub Action.

We will be creating a simple action that counts the Lines of Code (LOC) of a given type of file, and throws if the sum of LOC exceeds a given threshold.

Keep in mind that the source code is not production-ready and should only be used for learning.

The Action will receive three params:

  • fileOrFolderToProcess (optional): The file or folder to process
  • filesAndFoldersToIgnore (optional): A list of directories to ignore. It supports glob patterns.
  • maxCount (required): The maximum number of LOC for the sum of files.

The Action recursively iterates over all files under the folder to calculate the total amount of Lines of Code for our project.

During the process, the Actions will skip the files and folders marked to ignore, and at the end, if the max count is reached, we throw an error.

Additionally, we will set the total LOC in an Action output no matter the result of the Action.

Setting up the Environment

JavaScript Github Actions are not significantly different from any other Javascript project. We will set up some minimal configuration, but you should feel free to add your favorite workflow.

Let us start by creating the repository. As mentioned, we will use the Typescript Github Actions template, which will provide some basic configuration for us.

We start by visiting https://github.com/actions/typescript-action. We should see something like this:

typesscript-template-gh-actions

The first thing we need to do is add a start to the repo :). Once that is completed, we will then click on the "Use this template" button.

We are now in a regular "create new repository" page that we must fill.

Create a new repository page of GitHub

We can then create our new repository by clicking the "Create repository from template" button.

Excellent, now our repository is created. Let us take a look at what this template has provided for us.

Freshly Created Repository using the TypeScript Template

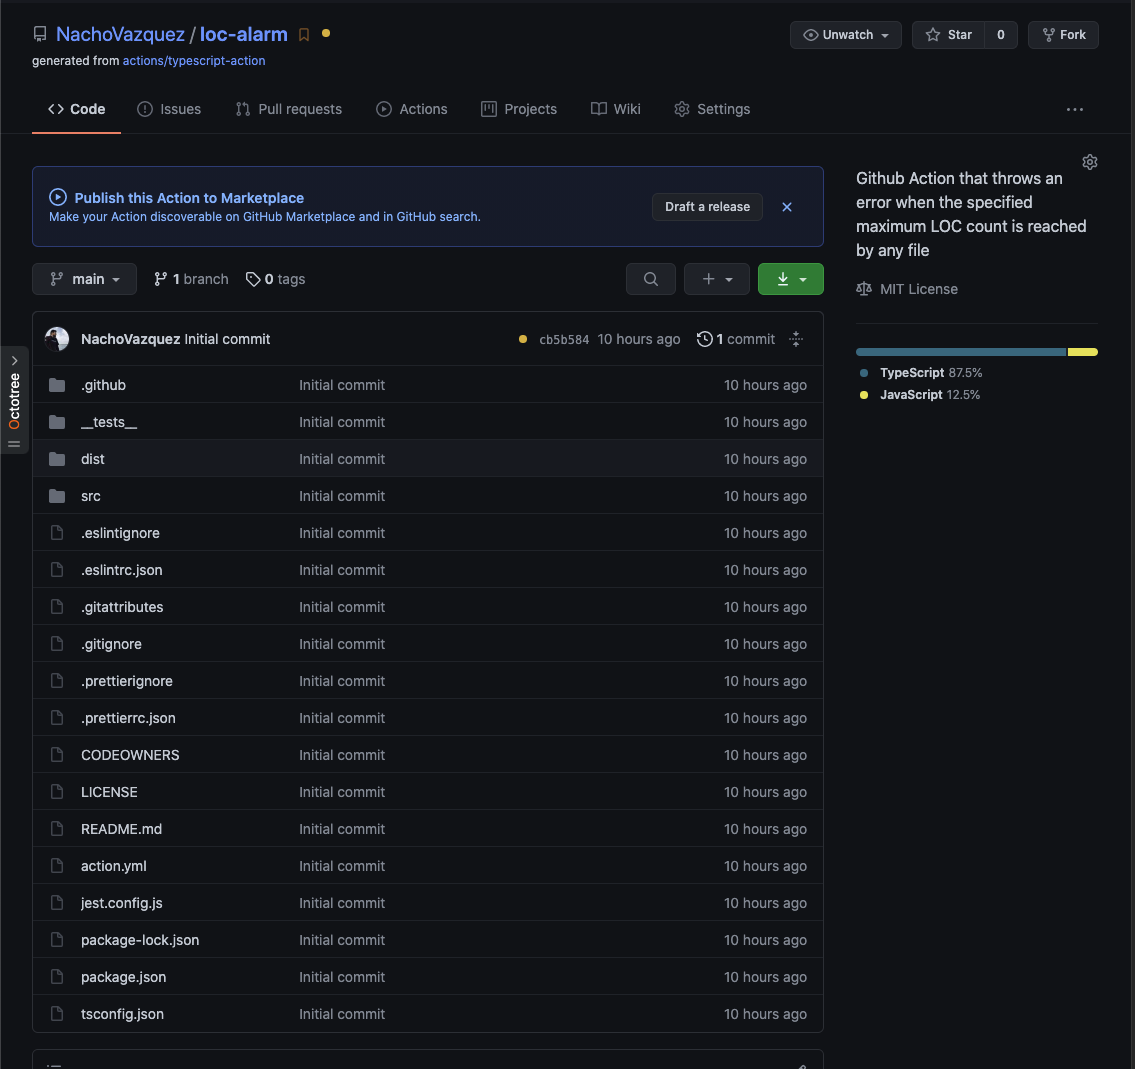
The first thing to notice is that Github recognizes that we are in a GitHub Actions source code. Because of that, GitHub provides a contextual button to start releasing our Action.

Publish to marketplace button

The file that allows this integration is the action.yml file. That is the action metadata container, including the name, description, inputs, and outputs. It is also where we will reference the entry point .js for our Action.

Action.yml with default data

The mentioned entry point will be located in the dist folder, and the files contained there is the result of building our Typescript files.

Important! Github uses the dist folder to run the Actions. Unlike other repositories, this build bundle MUST be included in the repository, and should not be ignored.

Our source code lives in the source folder. The main.ts is what would be compiled to our Action entry point index.js. There is where most of our work will be focused.

Additional files and configurations

In addition to the main files, the TypeScript template also adds configuration files for Jest, TypeScript, Prettier and ESLint.

A Readme template and a CODEOWNERS file are included, along with a LICENSE.

Lastly, it will also provide us with a GitHub CI YAML file with everything we need to e2e test our Action.

ci yaml file with pipeline steps

Final steps

To conclude our setup walkthrough, let us clone the repository. I will be using mine, but you should replace the repository with yours.

git clone https://github.com/NachoVazquez/loc-alarm.git

Navigate to the cloned project folder, and install the dependencies.

npm i

Now we are ready to start implementing our Action.

The implementation

First we must configure our action.yml file and define our API.

The metadata

The first three properties are mostly visual metadata for the Workspace, and the Actions tab.

name: 'Lines Of Code Alert'
description: 'Github Action that throws an error when the specified maximum LOC count is reached by any file'
author: 'Nacho Vazquez -- This Dot, Inc'

The name property is the name of your Action. GitHub displays the name in the Actions tab to help visually identify actions in each job.

GitHub will also use the name, the description, and the author of the Action to inform users about the Action goal in the Actions Marketplace.

Ensure a short and precise description; Doing so will help the users of the Action quickly identify the problem that the Action is solving.

Next, we define our inputs. Like we did with the Action, we should write a short and precise description to avoid confusion about the usage of each input variable.

inputs:
  fileOrFolderToProcess:
    required: false
    description: 'The file or folder to process'
    default: '.'
  filesAndFoldersToIgnore:
    required: false
    description: 'A list of directories to ignore. Supports glob patterns.'
    default: '["node_modules", ".git", "dist", ".github"]'
  maxCount:
    required: true
    description: 'The maximum number of LOC for the sum of files'

We will mark our inputs as required or optional, according to what we already specified when describing our plans for the Action.

The default values help provide pre-configured data to our Action.

As with the inputs, we must define the outputs.

outputs:
  locs:
    description: 'The amount of LOC of your project without comments and empty lines'

Actions that run later in a workflow can use the output data set in our Action run.

If you don't declare an output in your action metadata file, you can still set outputs and use them in a workflow.

However, it would not be evident for a user searching for the Action in the Marketplace since GitHub cannot detect outputs that are not defined in the metadata file.

Finally, we define the application running the Action and the entry point for the Action itself.

runs:
  using: 'node12'
  main: 'dist/index.js'

Now, let's see everything together so we can appreciate the big picture of our Action metadata.

name: 'Lines Of Code Alert'
description: 'Github Action that throws an error when the specified maximum LOC count is reached by any file'
author: 'Nacho Vazquez -- This Dot, Inc'
inputs:
  fileOrFolderToProcess:
    required: false
    description: 'The file or folder to process'
    default: '.'
  filesAndFoldersToIgnore:
    required: false
    description: 'A list of directories to ignore. Supports glob patterns.'
    default: '["node_modules", ".git", "dist", ".github"]'
  maxCount:
    required: true
    description: 'The maximum number of LOC for the sum of files'
outputs:
  locs:
    description: 'The amount of LOC of your project without comments and empty lines'
runs:
  using: 'node12'
  main: 'dist/index.js'

The Code

Now that we have defined all our metadata and made GitHub happy, we can start coding our Action.

Our code entry point is located at src/maint.ts. Let's open the file in our favorite IDE and start coding.

Let's clean all the unnecessary code that the template created for us. We will, however, keep the core tools import.

import * as core from '@actions/core'

The core library will give us all the tools we need to interact with the inputs and outputs, force the step to fail, add debugging information, and much more. Discover all the tools provided by the Github Actions Toolkit.

After cleaning up all of the example code, the initial step would be extracting and transforming our inputs to a proper form.

// extract inputs
const filesAndFoldersToIgnore = JSON.parse(
  core.getInput('filesAndFoldersToIgnore')
)
const maxCount: number = +core.getInput('maxCount')
const fileOrFolderToProcess: string = core.getInput('fileOrFolderToProcess')

With our inputs ready, we need to start thinking about counting our LOC while enforcing the input restrictions.

Luckily there is a couple of libraries that can do this for us. For this example, we will be using node-sloc, but feel free to use any other.

Go on and install the dependency using npm or any package manager that you prefer.

npm install --save node-sloc

Import the library.

import sloc from 'node-sloc'

And the rest of the implementation is straightforward.

// calculate loc stats
const stats = await sloc({
  path: fileOrFolderToProcess,
  extensions: ['ts', 'html', 'css', 'scss'],
  ignorePaths: filesAndFoldersToIgnore,
  ignoreDefault: true
})

Great! We have our LOC information ready. Let's use it to set the output defined in the metadata before doing anything else.

// set the output of the action
core.setOutput('locs', stats?.sloc)

Additionally, we will also provide debuggable data. Notice that debug information is only available if the repository owner activated debug logging capabilities.

// debug information is only available when enabling debug logging https://docs.github.com/en/actions/managing-workflow-runs/enabling-debug-logging
core.debug(`LOC ${stats?.sloc?.toString() || ''}`)
core.debug(`Max Count ${maxCount.toString() || ''}`)

Here is the link if you are interested in debugging the Action yourself.

Finally, verify that the count of the LOC is not exceeding the threshold.

// verify that locs threshold is not exceeded
if ((stats?.sloc || 0) > maxCount) {
  core.debug('Threshold exceeded')
  throw new Error(
    `The total amount of lines exceeds the maximum allowed.
     Total Amount: ${stats?.sloc}
     Max Count: ${maxCount}`
  )
}

If the threshold is exceeded, we use the core.setFailed, to make this action step fail and, therefore, the entire pipeline fails.

catch (error) {
  core.setFailed(error.message)
}

Excellent! We just finished our Action. Now we have to make it available for everyone.

But first, lets configure our CI to perform an e2e test of our Action.

Go to the file .github/workflows/*.yml. I called mine ci.yml but you can use whatever name makes sense to you.

name: 'loc-alarm CI'

on: # rebuild any PRs and main branch changes
  pull_request:
  push:
    branches:
      - main

jobs:
  build: # make sure build/ci work properly
    runs-on: ubuntu-latest
    steps:
      - uses: actions/checkout@v2
      - run: npm install
      - run: npm run build

  e2e:
    runs-on: ubuntu-latest
    steps:
      - uses: actions/checkout@v2
      - uses: ./
        id: e2e
        with:
          maxCount: '1000'
      # Use the output from the `e2e` step
      - name: Get the LOC
        run: echo "The project has ${{ steps.e2e.outputs.locs }} lines of code"

Here, we are triggering the pipeline whenever a pull request is created with base branch main or the main branch itself is pushed.

Then, we run the base setup steps, like installing the packages, and building the action to verify that everything works as it should.

Finally, we run e2e jobs that will test the actions as we were running it in an external application.

That's it! Now we can publish our Action with confidence.

Publish and versioning

Something you must not forget before any release is to build and package your Action.

npm run build && npm run package

These commands will compile your TypeScript and JavaScript into a single file bundle on the dist folder.

With that ready, we can commit our changes to the main branch, and push to origin.

Go back to your browser and navigate to the Action repository.

First, go to the Actions tab and verify that our pipeline is green and the Action is working as expected.

Action Pipeline green

After that check, go back to the "Code" tab, the home route of our repository.

Code tab loc-alarm repo

Remember the "Draft a release" button? Well, it is time to click it.

We are now on the releases page. This is where our first release will be created.

release action page

Click on the terms and conditions link, and agree with the terms to publish your actions.

Term and conditions
terms and conditions

Check the "Publish this Action to the Github Marketplace" input, and fill in the rest of the information.

fill release information

You can mark this as pre-release if you want to experiment with the Action before inviting users to use it.

pre release check

And that's it! Just click the "Publish release" button.

First release

Tada! Click in the marketplace button to see how your Action looks!

marketplace

After the first release is out, you will probably start adding features or fixing bugs. There are some best practices that you should follow while maintaining your versioning.

Use this guide to keep your version under control. But the main idea is that the major tag- v1 for instance- should always be referencing the latest tag with the same major version.

This means that if we release v1.9.3 we should update v1 to the same commit as v1.9.3.

Our Action is ready. The obvious next step is to test it with a real application.

Using the Action

Now it is time to test our Action, and see how it works in the wild.

We are going to use our Plugin Architecture example application. If you have read that article yet, here is the link.

The first thing we need to do is create a new git branch.

After that, we create our ci.yml file under .github/workflows.

And we add the following pipeline code.

name: Plugin Architecture CI

on:
  pull_request:
  push:
    branches:
      - main

jobs:
  loc:
    runs-on: ubuntu-latest
    steps:
      - uses: actions/checkout@v2
      - uses: NachoVazquez/loc-alarm@v1
        id: loc-alert
        with:
          maxCount: 1000
      - name: Print the LOC
        run: echo "The project has ${{ steps.loc-alert.outputs.locs }} lines of code."

Basically, we are just triggering this Action when a PR is created using main as the base branch, or if we push directly to main.

Then, we add a single job that will checkout the PR branch and use our Action with a max count of 200.

Finally, we print the value of our output variable.

Save, commit, and push.

Create your PR, go to the check tab, and see the result of your effort.

create pr

Great! We have our first failing custom GitHub action.

failing ci

Now, 200 is a bit strict. Maybe 1000 lines of code are more appropriate.

Adjust your step, commit, and push to see your pipeline green and passing.

successful pipeline

How great is that!?

Conclusion

Writing Custom GitHub Actions using JavaScript and TypeScript is really easy, but it can seem challenging when we are not familiar with the basics.

We covered an end-to-end tutorial about creating, implementing, publishing, and testing your Custom GitHub Action.

This is really just the beginning. There are unlimited possibilities to what you can create using GitHub Actions.

Use what you learned today to make the community a better place with the tools you can create for everyone.

This Dot is a consultancy dedicated to guiding companies through their modernization and digital transformation journeys. Specializing in replatforming, modernizing, and launching new initiatives, we stand out by taking true ownership of your engineering projects.

We love helping teams with projects that have missed their deadlines or helping keep your strategic digital initiatives on course. Check out our case studies and our clients that trust us with their engineering.

You might also like

The Future of Dates in JavaScript: Introducing Temporal cover image

The Future of Dates in JavaScript: Introducing Temporal

The Future of Dates in JavaScript: Introducing Temporal What is Temporaal? Temporal is a proposal currently at stage 3 of the TC39 process. It's expected to revolutionize how we handle dates in JavaScript, which has always been a challenging aspect of the language. But what does it mean that it's at stage 3 of the process? * The specification is complete * It has been reviewed * It's unlikely to change significantly at this point Key Features of Temporal Temporal introduces a new global object with a fresh API. Here are some important things to know about Temporal: 1. All Temporal objects are immutable 2. They're represented in local calendar systems, but can be converted 3. Time values use 24-hour clocks 4. Leap seconds aren't represented Why Do We Need Temporal? The current Date object in JavaScript has several limitations: * No support for time zones other than the user's local time and UTC * Date objects can be mutated * Unpredictable behavior * No support for calendars other than Gregorian * Daylight savings time issues While some of these have workarounds, not all can be fixed with the current Date implementation. Let's see some useful examples where Temporal will improve our lives: Some Examples Creating a day without a time zone is impossible using Date, it also adds time beyond the date. Temporal introduces PlainDate to overcome this. ` But what if we want to add timezone information? Then we have ZonedDateTime for this purpose. The timezone must be added in this case, as it also allows a lot of flexibility when creating dates. ` Temporal is very useful when manipulating and displaying the dates in different time zones. ` Let's try some more things that are currently difficult or lead to unexpected behavior using the Date object. Operations like adding days or minutes can lead to inconsistent results. However, Temporal makes these operations easier and consistent. ` Another interesting feature of Temporal is the concept of Duration, which is the difference between two time points. We can use these durations, along with dates, for arithmetic operations involving dates and times. Note that Durations are serialized using the ISO 8601 duration format ` Temporal Objects We've already seen some of the objects that Temporal exposes. Here's a more comprehensive list. * Temporal * Temporal.Duration` * Temporal.Instant * Temporal.Now * Temporal.PlainDate * Temporal.PlainDateTime * Temporal.PlainMonthDay * Temporal.PlainTime * Temporal.PlainYearMonth * Temporal.ZonedDateTime Try Temporal Today If you want to test Temporal now, there's a polyfill available. You can install it using: ` Note that this doesn't install a global Temporal object as expected in the final release, but it provides most of the Temporal implementation for testing purposes. Conclusion Working with dates in JavaScript has always been a bit of a mess. Between weird quirks in the Date object, juggling time zones, and trying to do simple things like ā€œadd a day,ā€ it’s way too easy to introduce bugs. Temporal is finally fixing that. It gives us a clear, consistent, and powerful way to work with dates and times. If you’ve ever struggled with JavaScript dates (and who hasn’t?), Temporal is definitely worth checking out....

The Importance of a Scientific Mindset in Software Engineering: Part 2 (Debugging) cover image

The Importance of a Scientific Mindset in Software Engineering: Part 2 (Debugging)

The Importance of a Scientific Mindset in Software Engineering: Part 2 (Debugging) In the first part of my series on the importance of a scientific mindset in software engineering, we explored how the principles of the scientific method can help us evaluate sources and make informed decisions. Now, we will focus on how these principles can help us tackle one of the most crucial and challenging tasks in software engineering: debugging. In software engineering, debugging is often viewed as an art - an intuitive skill honed through experience and trial and error. In a way, it is - the same as a GP, even a very evidence-based one, will likely diagnose most of their patients based on their experience and intuition and not research scientific literature every time; a software engineer will often rely on their experience and intuition to identify and fix common bugs. However, an internist faced with a complex case will likely not be able to rely on their intuition alone and must apply the scientific method to diagnose the patient. Similarly, a software engineer can benefit from using the scientific method to identify and fix the problem when faced with a complex bug. From that perspective, treating engineering challenges like scientific inquiries can transform the way we tackle problems. Rather than resorting to guesswork or gut feelings, we can apply the principles of the scientific method—forming hypotheses, designing controlled experiments, gathering and evaluating evidence—to identify and eliminate bugs systematically. This approach, sometimes referred to as "scientific debugging," reframes debugging from a haphazard process into a structured, disciplined practice. It encourages us to be skeptical, methodical, and transparent in our reasoning. For instance, as Andreas Zeller notes in the book _Why Programs Fail_, the key aspect of scientific debugging is its explicitness: Using the scientific method, you make your assumptions and reasoning explicit, allowing you to understand your assumptions and often reveals hidden clues that can lead to the root cause of the problem on hand. Note: If you'd like to read an excerpt from the book, you can find it on Embedded.com. Scientific Debugging At its core, scientific debugging applies the principles of the scientific method to the process of finding and fixing software defects. Rather than attempting random fixes or relying on intuition, it encourages engineers to move systematically, guided by data, hypotheses, and controlled experimentation. By adopting debugging as a rigorous inquiry, we can reduce guesswork, speed up the resolution process, and ensure that our fixes are based on solid evidence. Just as a scientist begins with a well-defined research question, a software engineer starts by identifying the specific symptom or error condition. For instance, if our users report inconsistencies in the data they see across different parts of the application, our research question could be: _"Under what conditions does the application display outdated or incorrect user data?"_ From there, we can follow a structured debugging process that mirrors the scientific method: - 1. Observe and Define the Problem: First, we need to clearly state the bug's symptoms and the environment in which it occurs. We should isolate whether the issue is deterministic or intermittent and identify any known triggers if possible. Such a structured definition serves as the groundwork for further investigation. - 2. Formulate a Hypothesis: A hypothesis in debugging is a testable explanation for the observed behavior. For instance, you might hypothesize: _"The data inconsistency occurs because a caching layer is serving stale data when certain user profiles are updated."_ The key is that this explanation must be falsifiable; if experiments don't support the hypothesis, it must be refined or discarded. - 3. Collect Evidence and Data: Evidence often includes logs, system metrics, error messages, and runtime traces. Similar to reviewing primary sources in academic research, treat your raw debugging data as crucial evidence. Evaluating these data points can reveal patterns. In our example, such patterns could be whether the bug correlates with specific caching mechanisms, increased memory usage, or database query latency. During this step, it's essential to approach data critically, just as you would analyze the quality and credibility of sources in a research literature review. Don't forget that even logs can be misleading, incomplete, or even incorrect, so cross-referencing multiple sources is key. - 4. Design and Run Experiments: Design minimal, controlled tests to confirm or refute your hypothesis. In our example, you may try disabling or shortening the cache's time-to-live (TTL) to see if more recent data is displayed correctly. By manipulating one variable at a time - such as cache invalidation intervals - you gain clearer insights into causation. Tools such as profilers, debuggers, or specialized test harnesses can help isolate factors and gather precise measurements. - 5. Analyze Results and Refine Hypotheses: If the experiment's outcome doesn't align with your hypothesis, treat it as a stepping stone, not a dead end. Adjust your explanation, form a new hypothesis, or consider additional variables (for example, whether certain API calls bypass caching). Each iteration should bring you closer to a better understanding of the bug's root cause. Remember, the goal is not to prove an initial guess right but to arrive at a verifiable explanation. - 6. Implement and Verify the Fix: Once you're confident in the identified cause, you can implement the fix. Verification doesn't stop at deployment - re-test under the same conditions and, if possible, beyond them. By confirming the fix in a controlled manner, you ensure that the solution is backed by evidence rather than wishful thinking. - Personally, I consider implementing end-to-end tests (e.g., with Playwright) that reproduce the bug and verify the fix to be a crucial part of this step. This both ensures that the bug doesn't reappear in the future due to changes in the codebase and avoids possible imprecisions of manual testing. Now, we can explore these steps in more detail, highlighting how the scientific method can guide us through the debugging process. Establishing Clear Debugging Questions (Formulating a Hypothesis) A hypothesis is a proposed explanation for a phenomenon that can be tested through experimentation. In a debugging context, that phenomenon is the bug or issue you're trying to resolve. Having a clear, falsifiable statement that you can prove or disprove ensures that you stay focused on the real problem rather than jumping haphazardly between possible causes. A properly formulated hypothesis lets you design precise experiments to evaluate whether your explanation holds true. To formulate a hypothesis effectively, you can follow these steps: 1. Clearly Identify the Symptom(s) Before forming any hypothesis, pin down the specific issue users are experiencing. For instance: - "Users intermittently see outdated profile information after updating their accounts." - "Some newly created user profiles don't reflect changes in certain parts of the application." Having a well-defined problem statement keeps your hypothesis focused on the actual issue. Just like a research question in science, the clarity of your symptom definition directly influences the quality of your hypothesis. 2. Draft a Tentative Explanation Next, convert your symptom into a statement that describes a _possible root cause_, such as: - "Data inconsistency occurs because the caching layer isn't invalidating or refreshing user data properly when profiles are updated." - "Stale data is displayed because the cache timeout is too long under certain load conditions." This step makes your assumption about the root cause explicit. As with the scientific method, your hypothesis should be something you can test and either confirm or refute with data or experimentation. 3. Ensure Falsifiability A valid hypothesis must be falsifiable - meaning it can be proven _wrong_. You'll struggle to design meaningful experiments if a hypothesis is too vague or broad. For example: - Not Falsifiable: "Occasionally, the application just shows weird data." - Falsifiable: "Users see stale data when the cache is not invalidated within 30 seconds of profile updates." Making your hypothesis specific enough to fail a test will pave the way for more precise debugging. 4. Align with Available Evidence Match your hypothesis to what you already know - logs, stack traces, metrics, and user reports. For example: - If logs reveal that cache invalidation events aren't firing, form a hypothesis explaining why those events fail or never occur. - If metrics show that data served from the cache is older than the configured TTL, hypothesize about how or why the TTL is being ignored. If your current explanation contradicts existing data, refine your hypothesis until it fits. 5. Plan for Controlled Tests Once you have a testable hypothesis, figure out how you'll attempt to _disprove_ it. This might involve: - Reproducing the environment: Set up a staging/local system that closely mimics production. For instance with the same cache layer configurations. - Varying one condition at a time: For example, only adjust cache invalidation policies or TTLs and then observe how data freshness changes. - Monitoring metrics: In our example, such monitoring would involve tracking user profile updates, cache hits/misses, and response times. These metrics should lead to confirming or rejecting your explanation. These plans become your blueprint for experiments in further debugging stages. Collecting and Evaluating Evidence After formulating a clear, testable hypothesis, the next crucial step is to gather data that can either support or refute it. This mirrors how scientists collect observations in a literature review or initial experiments. 1. Identify "Primary Sources" (Logs, Stack Traces, Code History): - Logs and Stack Traces: These are your direct pieces of evidence - treat them like raw experimental data. For instance, look closely at timestamps, caching-related events (e.g., invalidation triggers), and any error messages related to stale reads. - Code History: Look for related changes in your source control, e.g. using Git bisect. In our example, we would look for changes to caching mechanisms or references to cache libraries in commits, which could pinpoint when the inconsistency was introduced. Sometimes, reverting a commit that altered cache settings helps confirm whether the bug originated there. 2. Corroborate with "Secondary Sources" (Documentation, Q&A Forums): - Documentation: Check official docs for known behavior or configuration details that might differ from your assumptions. - Community Knowledge: Similar issues reported on GitHub or StackOverflow may reveal known pitfalls in a library you're using. 3. Assess Data Quality and Relevance: - Look for Patterns: For instance, does stale data appear only after certain update frequencies or at specific times of day? - Check Environmental Factors: For instance, does the bug happen only with particular deployment setups, container configurations, or memory constraints? - Watch Out for Biases: Avoid seeking only the data that confirms your hypothesis. Look for contradictory logs or metrics that might point to other root causes. You keep your hypothesis grounded in real-world system behavior by treating logs, stack traces, and code history as primary data - akin to raw experimental results. This evidence-first approach reduces guesswork and guides more precise experiments. Designing and Running Experiments With a hypothesis in hand and evidence gathered, it's time to test it through controlled experiments - much like scientists isolate variables to verify or debunk an explanation. 1. Set Up a Reproducible Environment: - Testing Environments: Replicate production conditions as closely as possible. In our example, that would involve ensuring the same caching configuration, library versions, and relevant data sets are in place. - Version Control Branches: Use a dedicated branch to experiment with different settings or configuration, e.g., cache invalidation strategies. This streamlines reverting changes if needed. 2. Control Variables One at a Time: - For instance, if you suspect data inconsistency is tied to cache invalidation events, first adjust only the invalidation timeout and re-test. - Or, if concurrency could be a factor (e.g., multiple requests updating user data simultaneously), test different concurrency levels to see if stale data issues become more pronounced. 3. Measure and Record Outcomes: - Automated Tests: Tests provide a great way to formalize and verify your assumptions. For instance, you could develop tests that intentionally update user profiles and check if the displayed data matches the latest state. - Monitoring Tools: Monitor relevant metrics before, during, and after each experiment. In our example, we might want to track cache hit rates, TTL durations, and query times. - Repeat Trials: Consistency across multiple runs boosts confidence in your findings. 4. Validate Against a Baseline: - If baseline tests manifest normal behavior, but your experimental changes manifest the bug, you've isolated the variable causing the issue. E.g. if the baseline tests show that data is consistently fresh under normal caching conditions but your experimental changes cause stale data. - Conversely, if your change eliminates the buggy behavior, it supports your hypothesis - e.g. that the cache configuration was the root cause. Each experiment outcome is a data point supporting or contradicting your hypothesis. Over time, these data points guide you toward the true cause. Analyzing Results and Iterating In scientific debugging, an unexpected result isn't a failure - it's valuable feedback that brings you closer to the right explanation. 1. Compare Outcomes to the hypothesis. For instance: - Did user data stay consistent after you reduced the cache TTL or fixed invalidation logic? - Did logs show caching events firing as expected, or did they reveal unexpected errors? - Are there only partial improvements that suggest multiple overlapping issues? 2. Incorporate Unexpected Observations: - Sometimes, debugging uncovers side effects - e.g. performance bottlenecks exposed by more frequent cache invalidations. Note these for future work. - If your hypothesis is disproven, revise it. For example, the cache may only be part of the problem, and a separate load balancer setting also needs attention. 3. Avoid Confirmation Bias: - Don't dismiss contrary data. For instance, if you see evidence that updates are fresh in some modules but stale in others, you may have found a more nuanced root cause (e.g., partial cache invalidation). - Consider other credible explanations if your teammates propose them. Test those with the same rigor. 4. Decide If You Need More Data: - If results aren't conclusive, add deeper instrumentation or enable debug modes to capture more detailed logs. - For production-only issues, implement distributed tracing or sampling logs to diagnose real-world usage patterns. 5. Document Each Iteration: - Record the results of each experiment, including any unexpected findings or new hypotheses that arise. - Through iterative experimentation and analysis, each cycle refines your understanding. By letting evidence shape your hypothesis, you ensure that your final conclusion aligns with reality. Implementing and Verifying the Fix Once you've identified the likely culprit - say, a misconfigured or missing cache invalidation policy - the next step is to implement a fix and verify its resilience. 1. Implementing the Change: - Scoped Changes: Adjust just the component pinpointed in your experiments. Avoid large-scale refactoring that might introduce other issues. - Code Reviews: Peer reviews can catch overlooked logic gaps or confirm that your changes align with best practices. 2. Regression Testing: - Re-run the same experiments that initially exposed the issue. In our stale data example, confirm that the data remains fresh under various conditions. - Conduct broader tests - like integration or end-to-end tests - to ensure no new bugs are introduced. 3. Monitoring in Production: - Even with positive test results, real-world scenarios can differ. Monitor logs and metrics (e.g. cache hit rates, user error reports) closely post-deployment. - If the buggy behavior reappears, revisit your hypothesis or consider additional factors, such as unpredicted user behavior. 4. Benchmarking and Performance Checks (If Relevant): - When making changes that affect the frequency of certain processes - such as how often a cache is refreshed - be sure to measure the performance impact. Verify you meet any latency or resource usage requirements. - Keep an eye on the trade-offs: For instance, more frequent cache invalidations might solve stale data but could also raise system load. By systematically verifying your fix - similar to confirming experimental results in research - you ensure that you've addressed the true cause and maintained overall software stability. Documenting the Debugging Process Good science relies on transparency, and so does effective debugging. Thorough documentation guarantees your findings are reproducible and valuable to future team members. 1. Record Your Hypothesis and Experiments: - Keep a concise log of your main hypothesis, the tests you performed, and the outcomes. - A simple markdown file within the repo can capture critical insights without being cumbersome. 2. Highlight Key Evidence and Observations: - Note the logs or metrics that were most instrumental - e.g., seeing repeated stale cache hits 10 minutes after updates. - Document any edge cases discovered along the way. 3. List Follow-Up Actions or Potential Risks: - If you discover additional issues - like memory spikes from more frequent invalidation - note them for future sprints. - Identify parts of the code that might need deeper testing or refactoring to prevent similar issues. 4. Share with Your Team: - Publish your debugging report on an internal wiki or ticket system. A well-documented troubleshooting narrative helps educate other developers. - Encouraging open discussion of the debugging process fosters a culture of continuous learning and collaboration. By paralleling scientific publication practices in your documentation, you establish a knowledge base to guide future debugging efforts and accelerate collective problem-solving. Conclusion Debugging can be as much a rigorous, methodical exercise as an art shaped by intuition and experience. By adopting the principles of scientific inquiry - forming hypotheses, designing controlled experiments, gathering evidence, and transparently documenting your process - you make your debugging approach both systematic and repeatable. The explicitness and structure of scientific debugging offer several benefits: - Better Root-Cause Discovery: Structured, hypothesis-driven debugging sheds light on the _true_ underlying factors causing defects rather than simply masking symptoms. - Informed Decisions: Data and evidence lead the way, minimizing guesswork and reducing the chance of reintroducing similar issues. - Knowledge Sharing: As in scientific research, detailed documentation of methods and outcomes helps others learn from your process and fosters a collaborative culture. Ultimately, whether you are diagnosing an intermittent crash or chasing elusive performance bottlenecks, scientific debugging brings clarity and objectivity to your workflow. By aligning your debugging practices with the scientific method, you build confidence in your solutions and empower your team to tackle complex software challenges with precision and reliability. But most importantly, do not get discouraged by the number of rigorous steps outlined above or by the fact you won't always manage to follow them all religiously. Debugging is a complex and often frustrating process, and it's okay to rely on your intuition and experience when needed. Feel free to adapt the debugging process to your needs and constraints, and as long as you keep the scientific mindset at heart, you'll be on the right track....

Deep Dive into Node.js with James Snell cover image

Deep Dive into Node.js with James Snell

Node.js is one of the most used engines globally, and it is unique in the approach it follows to make our code work. As developers, we usually ignore how the underlying tools we use in daily work. In this article, we will deep dive into the Node.js internals using James Snell's talk as our guide, but we will expand in some areas to clarify some of the concepts discussed. We will learn about the Event Loop and the asynchronous model of Node.js. We will understand Event Emitters and how they power almost everything inside Node, and then we will build on that knowledge to understand what Streams are, and how they work. Event Loop We will begin our journey inside Node.js by exploring the Event Loop. The Event Loop is one of the most critical aspects of Node.js to understand. The Event Loop is the big orchestrator- the mechanism in charge of scheduling Node.js' synchronous and asynchronous nature. This section teaches how everything related to the scheduling mechanism works. When the Node.js process begins, it starts multiple threads: the Main process thread and the Libuv pool threads with four worker threads by default. The Libuv thread concern is handling heavy load work like IO by reading files from the disc, running some encryption, or reading from a socket. We can see the Event Loop as a glorified for/while loop that lives inside the main thread. The loop process happens at the C++ level. The Event Loop must perform several steps to complete a full back-around iteration. These steps will involve performing different checks and listening to OS events, like checking if there are any timers expired that need to be fired. It will check if there is any pending IO to process or schedule. These tasks run at the C++ level, but the event associated with the steps usually involves a callback like the action to execute when a timer expires, or a new chunk of a file is ready to be processed. When this happens, the callback executes in Javascript. Because the event loop exists in the process main thread, every time one of the steps of the event loop is processed, the event loop and the main thread are blocked until that step completes. This means that even if the Libuv is still executing the IO operations while the main thread is completing one-step tasks, the result of the IO operations is not accessible until the main thread is unblocked and iterates to the step that handles that result. "There is no such thing as asynchronous Javascript" James Snell But if asynchronous doesn't exist in Node and Javascript. What are promises for? Promises are just a mechanism to defer processing to the future. The power of Promises is the ability to schedule code execution after a specific set of events happens. But we will learn more about Promises later in this article. Step Execution Now that we understand the event loop high-level picture, it is time to go one level deeper and understand what happens in each step of the Event Loop. We learned that each step of the event loop executes in C++, but what happens if that step needs to run some Javascript? The C++ step code will use the V8 APIs to execute the passed Javascript code in a synchronous call. That Javascript code could have calls to a Node API named process.nextTick(fn), which receives another function as an argument. > "nextTick is not a good name because no tick is involved." James Snell If present, the process.nextTick(fn) appends its argument function in queue data structure. Later, we will find that there is a second queue where the Javascript code can append functions. But for simplicity, let's assume for now that there is only one queue: the nextTick queue. Once the Javascript runs and completes filling the queue through the process.nextTick method, it will return control to the C++ layer. Now it is time for Node to drain the nextTick Queue synchronously, in the order they were added, by running each of the functions added to the nextTick queue. Only when the queue is empty can the event loop move to the next step and start again with the same process. Remember everything described before runs asynchronously. > "Any time you have Javascript running, anything else is happening" James Snell Therefore, the key to keeping your Javascript performant is to keep your functions small, and use a scheduling mechanism to defer work. But what is the scheduling mechanism? The scheduling mechanisms are the instruments through which Node.js can simulate asynchronicity by scheduling the execution of a given Javascript function to a given time in the future. The scheduling mechanisms are the nextTick queue and the Microtask queue. The difference between these two is the order in which they execute. NodeJS will only start draining the Microtasks queue after the nextTick queue is empty. And the nextTick queue after the call stack is empty. The call stack is a LIFO (Last In, First Out) stack data structure. The operations from the stack are completely synchronous and are scheduled to run ASAP. The v8 API that we saw before runs the Javascript code sent from the C++ layer by adding and removing the statements into the stack, and executing them as corresponding. We saw how the nextTick queue is filled by the V8 execution when processing one statement from the stack, and how it drains as soon as C++ processes the Javascript stack. The Microtask queue is the one that process Promises continuation like events, catches, and finallies in V8. It is drained immediately after the nextTick queue is empty. Let's paint a picture of how this works. The following represents a function body executing several tasks. ` But the final order in which Node will execute this code looks more like ` Notice how nextTick is processed after the stack of operations is emptied, and the Microstask operations (the promise continuations) are deferred to just after the nextTick queue is emptied. However, there are other scheduling mechanisms: - Timers like setTimeout, setInterval, etc - Inmediates, the execution order of which is combined with timers, but they are not timers. A setInmediate(fn) registers a callback that will execute at the end of the current event loop turn, or just before the next event loop turn starts. - Promises, which are not the same as promises event continuation, which is what the Microstask handles. - Callbacks on the native layers this is something that is not necessarily available to the javascript developer. - Workers threads are separate node instances with their own process main thread, their own Libuv threads, and their own event loop. It is basically a complete Node instance running in a separate thread. Because it is a separate Node instance, it can run Javascript Node in parallel to the main Node instance. > "NextTick and Immediate names should be inverted because NextTick operations happen immediately after the Javascript stack is empty and Immediate functions will happen just before the nextTick start." To find complementary resources, you can go to the Node.js documentation. Event Emitter Event emitters are one of the first Node APIs ever created. Almost everything in Node is an event emitter. It is the first thing that loads and is fundamental to how Node works. If you see an object with the following methods, you have an event emitter. ` But how do these work? Inside the event emitter object, we have a map/look-up table, which is just another object. Inside each map entry, the key is the event name, and the value is an array of callback functions. The on method on the event emitter object receives the event name as the first argument, and a callback function as its second. When called, this method adds the on callback function into the corresponding array of the look-up table. The once method behaves like the on method, but with a key difference; instead of storing the once callback function directly, it will wrap it inside another function, and then add the wrapped function to the array. When the wrapper function gets executed, it will execute the wrapped callback function, removing itself from the array. On the other hand, emit uses the event name to access the corresponding array. It will create a backup copy of the array, and iterate synchronously over each callback function of the array executing it. It is important to highlight that emit is synchronous. If any of the callback functions on the array take a long time to execute, the main thread will be blocked. Emit won't return until all of functions on the array have executed. The asynchronous behavior of the emit is an illusion. This effect is caused because internally, Node will invoke each callback function using a nextTick, and therefore deferring the function's execution into the future. You can find more info about Event Emitter at the Node.js documentation. Streams (Node | Web) Streams are one of the fundamental concepts that power Node.js applications. They are a way to handle reading/writing files, network communications, or any end-to-end information exchange efficiently. Streams are not a concept unique to Node.js. They were introduced in the Unix operating system decades ago, and programs can interact with each other by passing streams through the pipe operator (|). For example, traditionally, when you tell the program to read a file, it is read into memory, from start to finish, and then you process it. You read it piece by piece using streams, processing its content without keeping it all in memory. The Node.js stream module provides the foundation upon which all streaming APIs are built. All streams are instances of EventEmitter. Node Streams There are four Node stream types: Readable, Writable, Duplex, and Transform. All of them are Event Emitters. Readable: a stream you can pipe from but not pipe into (you can receive data, but not send data to it). When you push data into a readable stream, it is buffered until a consumer starts to read the data. Writable: a stream you can pipe into but not pipe from (you can send data but not receive from it). Duplex: a stream you can both pipe into and pipe from. Basically a combination of a Readable and Writable stream. Transform: a Transform stream is similar to a Duplex, but the output is a transform of its input. Readable Stream The Readable stream works through a queue and the highwatermark in an oversimplified way. The highwatermark will delimit how much data can be in the queue, but the Readable Stream will not enforce that limit. Every time data is pushed into the queue, the stream will give feedback to the client code, telling if the highwatermark was reached or not, and transferring the responsibility to the client. The client code must decide if it continues pushing data and overflowing the queue. This feedback is received through the push method, which is the mechanism for pushing data into the queue. If the push method returns true, the highwatermark has not been reached, and you can push more. If the push method returns false that means that the highwatermark has been reached, and you are not supposed to push more, but you can. Events When data has been pushed into the queue, the internal of the Readable Stream will emit a couple of events. The on:readable is part of the pull model; it alerts that this stream is readable and has data to be read. If you are listening to the on:readable event, a read method can be called. When the client code calls the read() method, it will get a chunk of data out of the queue, and it will dequeue it. Then, the client code can keep calling read until there is no more data in the queue. After emptying the queue, the client code can restart pulling data when the on:readable event triggers again. The on:read event is part of the push model. In this event, any new chunk of data that is pushed using the push method will be synchronously sent to its listeners. That means we don't need to call the read method. The data will arrive automatically. However, there is another crucial difference; the sent data will never be stored in the queue. The queue is only filled when there is no active on:read event listener. This is called the "flow" mode because the data just flows, and it doesn't get stored. Other events are the end event that would notice that there is no more data to be consumed from the stream. TheĀ 'close'Ā event is emitted when the stream and any underlying resources (a file descriptor, for example) have been closed. The event indicates that no more events will be emitted, and no further computation will occur. TheĀ 'error'Ā event may be emitted by aĀ ReadableĀ implementation. Typically, this may occur if the underlying stream cannot generate data due to an underlying internal failure or when a stream implementation attempts to push an invalid chunk of data. The key to understanding the Readable Streams and their events is that the Readable Streams are just Event Emitters. Like Event Emitters, the Readable Streams don't have anything built into it that is asynchronous. It will not call any of the scheduling mechanisms. Therefore they operate purely synchronously, and to obtain an asynchronous behavior, the client code needs to defer when to call the different event APIs like the read() and push() methods. Let's understand how! When creating a Readable Stream, we need to provide a read function. The stream will repeatedly call this read function as long as its buffer is not full; however, after it calls it once, it will wait until we call push before calling it again. If we synchronously call push after the Readable Stream called read and the buffer is not full, the stream will synchronously call read again, up until we call push(null), marking the end of the stream. Otherwise, we can defer the push calls to some other point in time, effectively making the Stream read calls operate asynchronously; we might, for example, wait for some File IO callback to return. Examples Creating a Readable Stream ` ` Using a Readable Stream ` Writable Stream The Writable Streams works similarly. When creating a Writable Stream, we need to provide a _write(chunk, encoding, callback) function, and it will be an external write(chunck) function. When the external write function is called, it will just call the internal _write function. The internal _write function must call its callback argument function. Let's imagine that we write ten chunks; when the first chunk is written, if the internal _write function doesn't invoke the callback function, what will happen is that the chunks will accumulate in the Writable Stream internal buffer. When the callback is invoked, it will grab the next chunk and write it, draining the buffer. This means that if the _write is calling the callback function synchronously, then all those writes will happen synchronously; if it is deferring invoking that callback, then all those calls will happen asynchronously, but the data will accumulate in the internal buffer up until the highwatermark is hit. Even then, you can decide to keep incrementation the buffer queue. Events Like the Readable Stream, the Writable Stream is an Event Emitter that will provide its events listeners with useful alerts. The on:drain event notifies that the Writable buffer is longer, and more writes are allowed. If a call toĀ the write function returnsĀ false, indicating backpressure, theĀ 'drain'Ā event will be emitted when it is appropriate to resume writing data to the stream. TheĀ 'close'Ā event is emitted when the stream and any underlying resources (a file descriptor, for example) have been closed. The event indicates that no more events will be emitted, and no further computation will occur. TheĀ 'error'Ā event is emitted if an error occurs while writing or piping data. The listener callback is passed a singleĀ ErrorĀ argument when called. TheĀ 'finish'Ā event is emitted after theĀ stream.end()Ā method has been called, and all data has been flushed to the underlying system. Examples Creating a Writable Stream ` Duplex Stream Duplex streams are streams that implement both theĀ ReadableĀ andĀ WritableĀ interfaces. We can see a Duplex stream as an object containing both a Readable Stream and a Writable Stream. These two internal objects are not connected, and each has independent buffers. They share some events; for example, when the close event emits, both Streams are closed. They still emit the stream type-specific events like the readable and read for the Readable Stream, or the drain for the Writable Stream independently. However, this doesn't mean that data will be available on the Readable stream if we write into the Writable Stream. Those are independent. Duplex streams are especially useful for Sockets. Transform Stream Transform streams areĀ DuplexĀ streams where the output is related to the input. Contrary to the Duplex streams, when we write some chunk of data into the Writable stream, that data will be passed to the Readable stream by calling a transform function and invoking the push method on the readable side with the transformed data. As with Duplex, both the Readable and the Writable sides will have independent buffers with their own highwatermark. Examples Creating a Transform Stream ` Web Streams In Web streams, we still see some of the concepts we have seen for Node Streams. There exist the Readable, Writable, Duplex, and Transform streams. However, they also have significant differences. Unlike Node streams, web streams are not Event Emitter-based but Promise-based. Another big difference is that Node streams support multiple event listeners at the same time, and each of those listeners will get a copy of the data, while Web streams are restricted to a single listener at a time, and it has no events in it; it is purely Promise-based. While Node streams work entirely synchronously because Web streams are Promise-based, they work entirely asynchronously. This happens because the continuation is always deferred to the MicroTasks queue. It is essential to highlight that Node streams are significantly faster than Web streams, while Web streams are much more portable than Node streams. So keep that in mind when you are planning to select one or the other. Readable stream To understand the underlying implementation of how this works, let's take the Readable stream and dissect it. The developer can pass the underlayingSource object to the constructor when creating a new Readable stream. We can define the pull(controller) function inside this object, which receives the Controller object as its first and only parameter. This is the function where the client code can push the data into the stream by defining a custom data pulling logic. The Controller object, argument of the pull() function, contains the enqueue() function. This is the equivalent to the Node Readable stream push() function, and it is used to push the callback function return data into the Readable stream. The reader object, is the element through which the Web Readable stream enforces a single listener or reader at the time. It can be accessed through the getReader() method of the stream. Inside the reader object, we can find the read() function, which returns a promise providing access to the next chunk in the stream's internal queue. When the client code of the stream calls read() from the reader object, this will look into the Controller data queue and check if there is any data. If there is data in the queue, it will only dequeue the first chunk of data from the queue and resolve the read promise. If there is no data in the queue, the stream is going to call the pull(controller) function defined in the stream constructor argument object. Then the pull(controller) function will run and as part of its execution, it will call the Controller function enqueue() to push data into the stream. After pushing the data in, the pull function will resolve the initial read() Promise with the data pushed in. Because the pull(controller) function can be an async function, and return a Promise, if it calls once and that Promise is not resolved yet, and the client code continues calling the read() function, those read promises are going to accumulate in a read queue. Now we have our data queue and the read queue, and every time a new data is enqueued into the data queue, the stream logic will check if there is some pending read promise in the read queue. If the read queue is not empty, the first pending Promise will be dequeued and resolved with the data enqueued in the data queue. We can see this process as the read queue and the data queue trying to balance each other out. Consequently, the read queue will not accumulate read promises if the data queue has data. And the opposite is also true; we will not accumulate data in the data queue if the read queue has unresolved promises. Example Creating a readable stream ` Conclusions There is immense beauty in the depths for those curious developers who are not afraid of diving into the deep waters of the Node.js inner mechanics. In this article, we barely start exploring some of the solutions chosen by the Node.js core contributors, and we have found how elegant and straightforward many of those solutions are. There is still much to learn about the internals of Node and the Browser engines, but I think this article and its companion Javascript Marathon are a great starting point. If you get here, thank you, and I hope you got inspired to continue digging into the tools that allow us to unleash our passion and creativity....

Implementing Dynamic Types in Docusign Extension Apps cover image

Implementing Dynamic Types in Docusign Extension Apps

Implementing Dynamic Types in Docusign Extension Apps In our previous blog post about Docusign Extension Apps, Advanced Authentication and Onboarding Workflows with Docusign Extension Apps, we touched on how you can extend the OAuth 2 flow to build a more powerful onboarding flow for your Extension Apps. In this blog post, we will continue explaining more advanced patterns in developing Extension Apps. For that reason, we assume at least basic familiarity with how Extension Apps work and ideally some experience developing them. To give a brief recap, Docusign Extension Apps are a powerful way to embed custom logic into Docusign agreement workflows. These apps are lightweight services, typically cloud-hosted, that integrate at specific workflow extension points to perform custom actions, such as data validation, participant input collection, or interaction with third-party services. Each Extension App is configured using a manifest file. This manifest defines metadata such as the app's author, support links, and the list of extension points it uses (these are the locations in the workflow where your app's logic will be executed). The extension points that are relevant for us in the context of this blog post are GetTypeNames and GetTypeDefinitions. These are used by Docusign to retrieve the types supported by the Extension App and their definitions, and to show them in the Maestro UI. In most apps, these types are static and rarely change. However, they don't have to be. They can also be dynamic and change based on certain configurations in the target system that the Extension App is integrating with, or based on the user role assigned to the Maestro administrator on the target system. Static vs. Dynamic Types To explain the difference between static and dynamic types, we'll use the example from our previous blog post, where we integrated with an imaginary task management system called TaskVibe. In the example, our Extension App enabled agreement workflows to communicate with TaskVibe, allowing tasks to be read, created, and updated. Our first approach to implementing the GetTypeNames and GetTypeDefinitions endpoints for the TaskVibe Extension App might look like the following. The GetTypeNames endpoint returns a single record named task: ` Given the type name task, the GetTypeDefinitions endpoint would return the following definition for that type: ` As noted in the Docusign documentation, this endpoint must return a Concerto schema representing the type. For clarity, we've omitted most of the Concerto-specific properties. The above declaration states that we have a task type, and this type has properties that correspond to task fields in TaskVibe, such as record ID, title, description, assignee, and so on. The type definition and its properties, as described above, are static and they never change. A TaskVibe task will always have the same properties, and these are essentially set in stone. Now, imagine a scenario where TaskVibe supports custom properties that are also project-dependent. One project in TaskVibe might follow a typical agile workflow with sprints, and the project manager might want a "Sprint" field in every task within that project. Another project might use a Kanban workflow, where the project manager wants a status field with values like "Backlog," "ToDo," and so on. With static types, we would need to return every possible field from any project as part of the GetTypeDefinitions response, and this introduces new challenges. For example, we might be dealing with hundreds of custom field types, and showing them in the Maestro UI might be too overwhelming for the Maestro administrator. Or we might be returning fields that are simply not usable by the Maestro administrator because they relate to projects the administrator doesn't have access to in TaskVibe. With dynamic types, however, we can support this level of customization. Implementing Dynamic Types When Docusign sends a request to the GetTypeNames endpoint and the types are dynamic, the Extension App has a bit more work than before. As we've mentioned earlier, we can no longer return a generic task type. Instead, we need to look into each of the TaskVibe projects the user has access to, and return the tasks as they are represented under each project, with all the custom fields. (Determining access can usually be done by making a query to a user information endpoint on the target system using the same OAuth 2 token used for other calls.) Once we find the task definitions on TaskVibe, we then need to return them in the response of GetTypeNames, where each type corresponds to a task for the given project. This is a big difference from static types, where we would only return a single, generic task. For example: ` The key point here is that we are now returning one type per task in a TaskVibe project. You can think of this as having a separate class for each type of task, in object-oriented lingo. The type name can be any string you choose, but it needs to be unique in the list, and it needs to contain the minimum information necessary to be able to distinguish it from other task definitions in the list. In our case, we've decided to form the ID by concatenating the string "task_" with the ID of the project on TaskVibe. The implementation of the GetTypeDefinitions endpoint needs to: 1. Extract the project ID from the requested type name. 1. Using the project ID, retrieve the task definition from TaskVibe for that project. This definition specifies which fields are present on the project's tasks, including all custom fields. 1. Once the fields are retrieved, map them to the properties of the Concerto schema. The resulting JSON could look like this (again, many of the Concerto properties have been omitted for clarity): ` Now, type definitions are fully dynamic and project-dependent. Caching of Type Definitions on Docusign Docusign maintains a cache of type definitions after an initial connection. This means that changes made to your integration (particularly when using dynamic types) might not be immediately visible in the Maestro UI. To ensure users see the latest data, it's useful to inform them that they may need to refresh their Docusign connection in the App Center UI if new fields are added to their integrated system (like TaskVibe). As an example, a newly added custom field on a TaskVibe project wouldn't be reflected until this refresh occurs. Conclusion In this blog post, we've explored how to leverage dynamic types within Docusign Extension Apps to create more flexible integrations with external systems. While static types offer simplicity, they can be constraining when working with external systems that offer a high level of customization. We hope that this blog post provides you with some ideas on how you can tackle similar problems in your Extension Apps....

Let's innovate together!

We're ready to be your trusted technical partners in your digital innovation journey.

Whether it's modernization or custom software solutions, our team of experts can guide you through best practices and how to build scalable, performant software that lasts.

Prefer email? hi@thisdot.co