Skip to content

Adding React to your ASP.NET MVC web app

Adding React to your ASP.NET MVC web app

This article was written over 18 months ago and may contain information that is out of date. Some content may be relevant but please refer to the relevant official documentation or available resources for the latest information.

Adding React to your ASP.NET MVC web app

In this article, we'll take a look how and why you might want to choose React to handle your front end considerations, and let ASP.NET manage the backend

Architecture

First, let's consider the range of responsibilities that each solution offers:

  • Templating - scaffolding out HTML markup based on page data
  • Routing - converting a request into a response
  • Middleware Pipeline - building assets
  • Model Binding - building usable model objects from HTML form data
  • API Services - handling data requests on a server
  • Client Side Interaction - updating a web page based on user interaction

For the most part, both of these frameworks offer ways to handle most of these concerns:

FeatureASP.NETReact
Templating
Routing
Middleware Pipeline
Model Binding
API Services
Client Side Interaction

Challenges when combining these two technologies include finding which pieces work best together.

Historically, ASP.NET has struggled to offer any sort of rich client experience out of the box. Because ASP.NET performs templating on the server, it's difficult to immediately respond to changes in state on the client without making a round trip, or writing the client side logic entirely separate from the rest of your application.

Also, React doesn't have anything to say about server-side considerations or API calls, so part of building any React app will involve picking how you want to handle requests on the server.

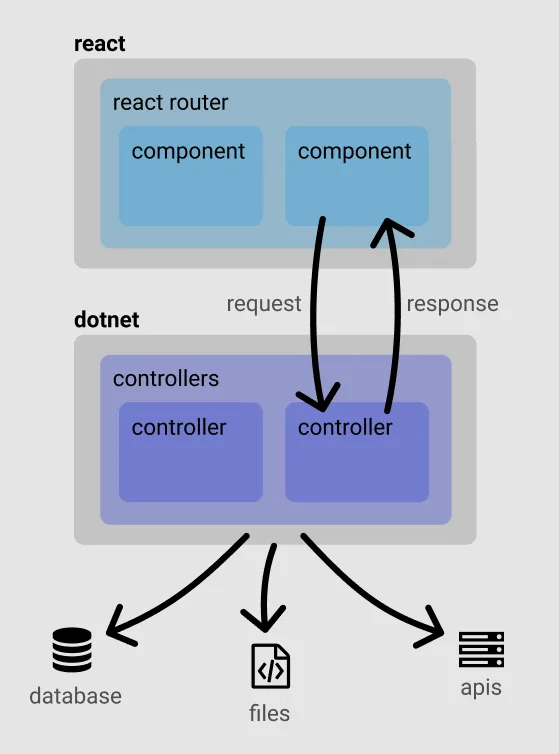
Here's roughly how we'll structure our architecture, with React taking care of all the client side concerns, and .NET handling the server side API.

architecture

Aside: Blazor is adding rich interactivity to .NET with a monolithic API. If you want to give your existing .cshtml super powers, that's another possible path to pursue, but there's already a large and vibrant ecosystem for using React to take care of front end architecture.

Prerequisites - If you don't have these, you'll need em'

Getting Started

.NET comes with its own react starter template which is documented here. We'll use it for this example. You can spin up a new project with the dotnet new command like this:

dotnet new react my-new-app

Note: If you have Visual Studio, you'll also see the available template starters under the the new project dialog new-web-app-templates

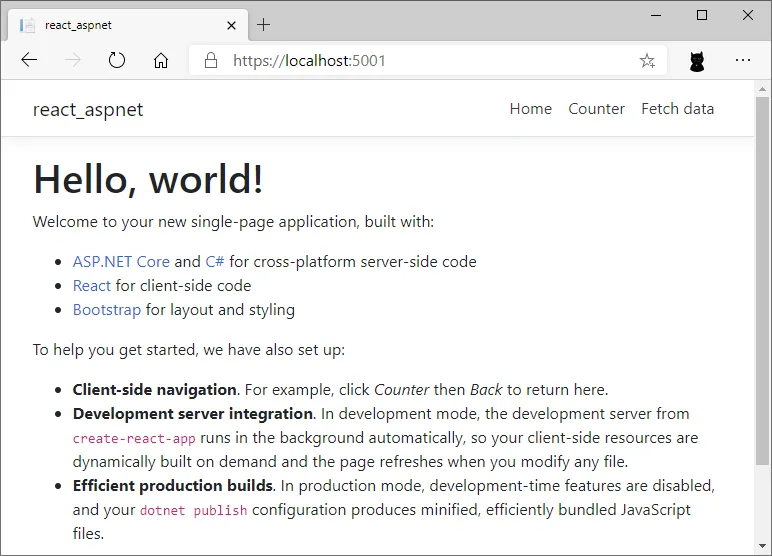
You should be able to cd into your application directory, open with VS Code, and launch with F5, or by running the following:

dotnet run

Which will be available at https://localhost:5001/

hello-world

Net React Starter

Let's review what this template adds, and how all the pieces fit together

File Structure

Here's a very high level view of some of the files involved

my-app
├── .vscode/          # vs code configs
├── bin/              # generated dotnet output
├── ClientApp         # React App - seeded with CRA
│   ├── build/        # generated react output
│   ├── public/       # static assets
│   ├── src/          # react app source
│   └── package.json  # npm configuration
├── Controllers/      # dotnet controllers
├── Models/           # dotnet models
├── Pages/            # razor pages
├── Program.cs        # dotnet entry point
├── Startup.cs        # dotnet app configuration
└── my-app.csproj     # project config and build steps

The startup.cs file will wire up the react application as asp.net middleware with the following services / configuration:

// ConfigureServices()
services.AddSpaStaticFiles(configuration =>
{
    configuration.RootPath = "ClientApp/build";
});

// Configure()
app.UseStaticFiles();
app.UseSpaStaticFiles();
app.UseSpa(spa =>
{
    spa.Options.SourcePath = "ClientApp";
    if (env.IsDevelopment())
    {
        spa.UseReactDevelopmentServer(npmScript: "start");
    }
});

This takes advantage of the Microsoft.AspNetCore.SpaServices.Extensions library on nuget to wire up some of the client side dependencies, and server kick off.

Finally, to wire up React to our .NET build step, there are a couple transforms in the .csproj file which run the local build process via npm and copy the build output to the .NET project.

<Target Name="PublishRunWebpack" AfterTargets="ComputeFilesToPublish">
  <!-- As part of publishing, ensure the JS resources are freshly built in production mode -->
  <Exec WorkingDirectory="$(SpaRoot)" Command="npm install" />
  <Exec WorkingDirectory="$(SpaRoot)" Command="npm run build" />
  <!-- ... -->
</Target>

Adding Functionality - More Cats Please

And finally, let's review how to leverage all of these existing components to start adding functionality to our application. We can take advantage of the fact that API calls can happen on the server-side, allowing us to protect API Keys and tokens, while also benefiting from immediate client updates without a full page refresh.

As an example, we'll use TheCatApi, which has a quick, easy, and free sign up process to get your own API key.

For this demo project, we'll add a random image viewer, a listing of all breeds, and a navigation component using react-router to navigate between them.

We can scaffold C# classes from the sample output, and processing, through JSON2CSharp, and we'll add them to the models folder.

MVC Controller - That's the C in MVC!

The controller will orchestrate all of the backend services. Here's an example that helps setup a wrapper around the cat API so we can simplify our client side logic, and forward the request on the backend, but we could also hit a database, filesystem, or any other backend interfaces. We'll deserialize the API into a strongly typed class using the new System.Text.Json.JsonSerializer. This is baked into .NET core, and saves us the historical dependency on Newtonsoft's JSON.NET. The API Controller can then just return data (wrapped up in a Task because we made our method async).

[ApiController]
[Route("api/[controller]")]
public class BreedsController : ControllerBase

    [HttpGet]
    public async Task<IEnumerable<Breed>> Get()
    {
        var BASE_URL = "https://api.thecatapi.com";

        using var client = new HttpClient();
        client.DefaultRequestHeaders.Add("x-api-key", _configuration["CatApiKey"]);

        var resp = await client.GetStringAsync(BASE_URL + "/v1/breeds");
        var breeds = JsonSerializer.Deserialize<Breed[]>(resp);

        return breeds;
    }

}

If we run the project, we should now be able to fetch data by navigating to /api/breed in the browser.

You can test check if it works by itself by going to https://localhost:5001/api/breed

Now let's load that up into a React component.

React Component - It's Reactive :D

Here's the basic structure of a React component:

import React, { useState } from 'react';

export function Breeds() {
  const [loading, setLoading] = useState(true);
  const [breeds, setBreeds] = useState([]);

  const contents = loading
    ? <p><em>Loading...</em></p>
    : renderBreedsTable(breeds);

  return (
    <div>
      <h1 id="tableLabel" >Get Breeds</h1>
      <p>This component demonstrates fetching data from the server.</p>
      {contents}
    </div>
  );
}

If this JavaScript is looking unfamiliar, it's because it's using JSX as well as ES6 syntax that's not supported by all browsers, which is why React needs to get preprocessed, by Babel, into something more universally understood to browsers. But let's take a look at what's going on piece-by-piece.

In order for JSX to be processed, we need to import React into our file (until React 17 that is).

The component function's primary responsibility is to return the HTML markup that we want to use one the page. Everything else is there to help manage state, or inform how to template and transform the data into HTML. So if we want a conditional, we can use the ternary operator (bool ? a : b), or if we want to transform items in an array, we could use Array.map to produce the output.

In order to manage state inside of a component, we use the React Hooks function useState, which returns two items in an array that we can deconstruct like this:

const [loading, setLoading] = useState(true);

This allows us to update the state of this property and informs React to dynamically re-render the output when we do so. For example, while loading, we can display some boilerplate text until the data has returned, and then update the view appropriately.

We'll want to fetch data on load, but sending async fetch calls during the initial execution can have some weird side effects, so we can use another hook called useEffect. Every time the component renders, we want to introduce an effect, so we'll put the initial call for data inside of there and it will fire as soon as the component goes live:

useEffect(async () => {
  const response = await fetch('/api/breeds');
  const data = await response.json();

  setBreeds(data)
  setLoading(false);
}, []);

This hits our backend API, gets the data, and updates our component state not only with the data, but also by toggling the loading indicator. Any updates to state that are used in the render function will cause it to kick off again and update the DOM automatically.

Let's imagine we create a second component, roughly the same as the first, to go get a random cat image. How do we handle navigation between both components. Many of the advantages to choosing React occur from preventing full page reloads on navigation. After all, your header, footer, loaded JS, and CSS libraries haven't changed - why should they get shipped to and parsed on the client from scratch. So we'll handle all navigational concerns within React as well.

Here's a pared down version of how that occurs:

  1. Our index.js file wraps the entire application in BrowserRouter from react-router-dom.
  2. It then loads our application component which passes Route objects with a path and component into the overall Layout.
  3. The layout then renders the "live" route by injecting this.props.children into the rest of the site layout.
  4. React router will handle the rest by only loading components when the path is navigated to in the browser or from other areas in the app.
// index.js
ReactDOM.render(
  <BrowserRouter basename={baseUrl}>
    <App />
  </BrowserRouter>,
  rootElement);

// app.js
export default function App() {
  return (
    <Layout>
      <Route exact path='/' component={RandomCat} />
      <Route path='/breeds' component={Breeds} />
    </Layout>
  );
}

// layout.js
export function Layout(props) {
  return (
    <div>
      <NavMenu />
      <Container>
        {props.children}
      </Container>
    </div>
  );
}

Wrap Up & Source Code

That's a quick run down of how you can combine both of these two technologies, and leverage the good parts of each.

There are many ways to explore each of these technologies on their own, and also try out use cases for using them together:

For more context, you can browse the full source code for the article on my Github at KyleMit/aspnet-react-cats.

What would you like to see added to this example next? Tweet me at KyleMitBTV.

This Dot is a consultancy dedicated to guiding companies through their modernization and digital transformation journeys. Specializing in replatforming, modernizing, and launching new initiatives, we stand out by taking true ownership of your engineering projects.

We love helping teams with projects that have missed their deadlines or helping keep your strategic digital initiatives on course. Check out our case studies and our clients that trust us with their engineering.

You might also like

Remix's evolution to a Vite plugin cover image

Remix's evolution to a Vite plugin

The Remix / React Router news is a beautiful illustration of software evolution. You start with a clear idea of what you’re building, but it’s impossible to anticipate exactly what it will become. If you haven’t heard the news yet, Ryan Florence announced at React Conf 2024 that Remix will be a Vite plugin for React Router. It’s a sort of surprising announcement but it makes a lot of sense if you’ve been following along as Remix the project has evolved. In this post we’ll recap the evolution of the project and then dig into what this change means for the future of Remix in the Server Components era of React. 🗓️ October 2021 > Remix is open sourced In the beginning, Remix cost money. In October 2021 they received some seed funding and the project was open sourced. Remix was an exciting new framework for server-rendering React websites that included API’s for loading data on the server and submitting data to the server with forms. It started a trend in the front-end framework space that a lot of other popular frameworks have modeled after or taken inspiration from. 🗓️ March 2022 - September 2022 > Remixing React Router At some point they realized that the API’s that they had created for Remix were a more natural fit in React Router. In this post Ryan details the plans to move these Remix API’s into React Router. Several months later, React Router 6.4 is released with the action, loader, and other Remix API’s baked in. > "We've always thought of Remix as "just a compiler and server for React Router" After this release, Remix is now mostly as they described - a compiler and server for React Router. 🗓️ October 2023 - February 2024 > Remix gets Vite support If you’re not familiar with Vite, it’s an extremely popular tool for front-end development that handles things like development servers and code bundling/compiling. A lot of the modern front-end frameworks are built on top of it. Remix announced support for Vite as an alternative option to their existing compiler and server. Since Remix is now mostly “just a compiler and server for React Router” - what’s left of Remix now that Vite can handle those things? 🗓️ May 2024 > Remix is React Router The Remix team releases a post detailing the announcement that Ryan made at React Conf. Looking back through the evolution of the project this doesn’t seem like an out of the blue, crazy announcement. Merging Remix API’s into React Router and then replacing the compiler and server with Vite didn’t leave much for Remix to do as a standalone project. 🐐 React Router - the past, present, and future of React React Router is one of the oldest, and most used packages in the React ecosystem. > Since Remix has always been effectively "React Router: The Framework", we wanted to create a bridge for all these React Router projects to be able to upgrade to Remix. With Remix being baked into React Router and now supporting SPA mode, legacy React Router applications have an easier path for migrating to the next generation of React. https://x.com/ryanflorence/status/1791488550162370709 Remix vs React 19 If you’ve taken a look at React 19 at all, it turns out it now handles a lot of the problems that Remix set out to solve in the first place. Things like Server Components, Server Actions, and Form Actions provide the same sort of programming model that Remix popularized. https://x.com/ryanflorence/status/1791484663883829258 Planned Changes for Remix and React Router Just recently, a post was published giving the exact details of what the changes to Remix and React Router will look like. tl;dr For React Router * React Router v6 to v7 will be a non-breaking upgrade * The Vite plugin from Remix is coming to React Router in v7 * The Vite plugin simply makes existing React Router features more convenient to use, but it isn't required to use React Router v7 * v7 will support both React 18 and React 19 For Remix * What would have been Remix v3 is React Router v7 * Remix v2 to React Router v7 will be a non-breaking upgrade * Remix is coming back better than ever in a future release with an incremental adoption strategy enabled by these changes For Both * React Router v7 comes with new features not in Remix or React Router today: RSC, server actions, static pre-rendering, and enhanced Type Safety across the board The show goes on I love how this project has evolved and I tip my hat to the Remix/React Router team. React Router feels like a cozy blanket in an ecosystem that is going through some major changes which feels uncertain and a little scary at times. The Remix / React Router story is still being written and I’m excited to see where it goes. I’m looking forward to seeing the work they are doing to support React Server Components. A lot of people are pretty excited about RSC’s and there is a lot of room for unique and interesting implementations. Long live React Router 🙌....

Improving INP in React and Next.js cover image

Improving INP in React and Next.js

Improving INP in React and Next.js In one of my previous articles, I've explained what INP is, how it works, and how it may affect your website. I also promised you to follow up with more concrete advice on how to improve your INP in your favorite framework. This is the follow-up article, where I'll focus on how to improve your INP score in React and Next.js. How to prepare for INP in React and Next.js? The first thing to do is to ensure you're using the latest version of React. The React team has been working on making React more INP-friendly and has already made some improvements in the latest versions. To enhance your INP score, consider fully taking advantage of new features introduced in React 18, such as Concurrent Rendering, Automatic Batching, and Selective Hydration. However, there are also some general areas to focus on, such as SSR and SSG in Next.js, Web Workers, or optimizing your hooks and state management. Concurrent Rendering The Concurrent Mode in React uses an algorithm that breaks rendering down into so-called "fiber nodes" and schedules the renders based on their expiration and priority. This effectively allows the user to interact with the page while the rendering is still in progress. In previous React versions, all updates, such as setState calls were treated as "urgent" and once the re-render had started, there was no way to interrupt it. Concurrent Mode changes this by being able to prioritize the updates and interrupt a non-blocking state update started with startTransition. For a simple explanation of concurrency in React, you can check out Dan Abramov's explanation. As part of the Concurrent Mode, React introduced several lifecycle methods that allow you to prioritize the rendering of certain parts of your UI, such as: - useTransition hook that allows you to update the state without blocking the UI, - useDeferredValue hook that allows you to defer the rendering of certain parts of your UI, - startTransition API that, similarly to the useTransition hook lets you mark a state update as non-blocking. It lacks, however, an indication of whether it's still pending. Automatic Batching Introduced in React 18, Automatic Batching reduces the number of re-renders that happen on state changes even when they happen outside of event handlers, e.g. in a setTimeout or Promise callback. This feature comes out of the box and you don't have to do anything to enable it, and it makes a great argument for upgrading to React 18. Selective Hydration Selective Hydration allows you to take hydration off the main thread by wrapping your components in a Suspense boundary. This way, components can become interactive faster as the browser can do other work on the main thread while the hydration is happening. To fully take advantage of selective hydration, consider the following: - Prioritizing Above-the-Fold Content: Use Suspense boundaries strategically around any parts of your application that may take the server longer to deliver to ensure they don’t block critical content from becoming interactive as soon as possible. - Hydration on Interaction: Implementing hydration upon user interaction for non-critical components can drastically reduce the main thread's workload, enhancing INP. Vercel even has a small case study showing how using selective hydration improved the performance of a Next.js site. Server-Side Rendering (SSR) and Static Site Generation (SSG) in Next.js Not everything has to run client-side. Next.js excels in SSR and SSG capabilities, which can significantly impact INP by delivering content to users faster. Optimizing SSR with techniques like incremental static regeneration (ISR) or leveraging SSG for static pages ensures that users can interact with content faster, improving the perceived performance. Workers Offloading heavy computations to Web Workers can free up the main thread, enhancing the responsiveness of React and Next.js applications. This strategy is especially useful when dealing with third-party scripts. Offloading such scripts in Next.js can be easily done by specifying the "worker" strategy on your Script component. Be aware that this feature is not yet stable and does not work with the app directory, though. If you want to take things one step further, you could use Partytown, which helps you offload any resource-intensive scripts to Web Workers. It comes with a React component that you can use to wrap your third-party scripts and offload them to a Web Worker, and it's compatible with Next.js as well. Hooks and State Management State management in React applications can easily get out of hand, leading to unnecessary re-renders and effectively an increased INP. Sometimes, using a state management library like Redux or MobX can help you consolidate your state and reduce the number of re-renders. However, they are not silver bullets and can also introduce performance issues if not used properly. If you are dealing with a lot of re-renders due to prop changes, make sure you are leveraging memoization. As of now, you may need to work with useMemo and useCallback hooks to memoize your values and functions, respectively. The upcoming React 19’s Forget Compiler, however, will apparently memoize everything under the hood, making these hooks obsolete. Using memoization properly can help you reduce the number of re-renders and improve your INP. To investigate your hook dependencies and re-renders, you can leverage React Developer Tools or use this handy helper hook I found on the internet to trace your re-renders: ` Conclusion Improving INP in React and Next.js is not easy and can require much investigation and fine-tuning. Still, it's worth doing to avoid being penalized by Google in its search results and provide a better experience for your users. Adopting React 18's new features, leveraging SSR and SSG in Next.js, utilizing Web Workers, and optimizing hooks and state management can significantly boost your INP score and deliver a faster application to your users. Remember, INP is just one among many performance metrics emphasizing the need for a comprehensive approach to performance optimization...

Build your Backend with Netlify Functions in 20 Minutes cover image

Build your Backend with Netlify Functions in 20 Minutes

Build your Backend with Netlify Functions in 20 minutes Netlify makes deploying your front end quick and easy, and Netlify functions makes running a serverless backend just as easy. In this guide, we'll get setup on how to use Netlify functions. As an indie developer, you should embrace serverless offerings because of their low barrier to entry and generous free tiers. And as an enterprise shop, you should seriously consider them for an extremely cheap, fast, and scalable way to build out your backend infrastructure. Use Cases - What can you build? Modern JavaScript frameworks allow us to build large and complex applications on the client, but they can occasionally run into limitations. For everything else, there's the "backend" which excels at handling some of these use cases: * Protecting Secrets & Credentials * Server Side Rendering * Sending Emails * Handling File IO * Running centralized logic * Executing tasks off the main thread * Bypassing CORS issues for locked down APIs * Providing Progressive Enhancement / NoScript Fallback Composition of a Function Netlify Functions provides a wrapper around AWS Lambdas. While the Netlify documentation should be sufficient, it's good to know that there's an escape hatch if you ever want to run on your own AWS subscription. However, Netlify handles some of the deployment magic for you, so let's start there. Here's the bare bones of a Netlify function in JavaScript: ` If you're familiar with running JavaScript on Node, this should look somewhat familiar. Each function should live in its own file, and will execute whatever is assigned to exports.handler. We have access to event and context. We can run whatever code we need on Node, and return whatever response type we'd like. To set this up, lets create an empty repository on GitHub. We need to add functions to a folder. While we can use any name, a common pattern is to create a folder name functions. Let's add a file in there called hello.js ` In our function, we can grab information from the query string parameters passed in. We'll destructure those (with a default value) and look for a name param. To actually wire up our functions folder, we'll need to add a netlify.toml config file at the root of our project. ` Walk Before You Run (Locally) Our "repo" should look like this at this point: ` The best way to run your Netlify site locally, with all the bells and whistles attached, is to use Netlify Dev which you can install via npm: ` And then kick off your dev server like this: ` Your "site" should now be live at http://localhost:8888. By default, Netlify hosts functions under the subpath /.netlify/functions/ so you can invoke your function here: http://localhost:8888/.netlify/functions/hello?name=Beth Now, let's make our function's address a little cleaner by also taking advantage of another free Netlify feature using redirects. This allows us to expose the same functions at a terser url by replacing /.netlify/functions with /api. FROM: /.netlify/functions/hello TO: /api/hello To do so, append the following info to your netlify.toml config, and restart Netlify dev: ` This will route all traffic at /api/* internally to the appropriate functions directory, and the wildcard will capture all additional path info, and move to :splat. By setting the HTTP Status Code = 200, Netlify will preform a "rewrite" (as opposed to a "redirect") which will change the server response without changing the URL in the browser address bar. So let's try again with our new url: http://localhost:8888/api/hello?name=Beth 👏 Awesome, you just created a function! (you're following along live, right?) Getting the CRUD Out & Submitting Data Now that we can build functions, let's create our own API with some basic CRUD functions (Create, Read, Update, & Delete) for a simple todos app. One of the central tenants of serverless computing is that it's also stateless. If you need to store any state across function invocations, it should be persisted to another, layer like a database. For this article, let's use the free tier of DynamoDb, but feel free to BYODB (Bring Your Own DB), especially if it has a Node SDK. In the next steps, we'll: 1. Setup a table on DynamoDB in AWS 2. Install npm packages into our project 3. Setup secret keys in AWS, and add to our environment variables 4. Initialize the aws-sdk package for NodeJs 5. And then finally add a Netlify function route to create a record on our database AWS - Amazon Web Services This guide will assume some degree of familiarity with AWS & DynamoDB, but if you're new to DynamoDB, you can start with this guide on Getting Started with Node.js and DynamoDB. On AWS, create a table with the name NetlifyTodos, and string partition key called key. NPM - Node Package Manager Now, let's setup npm and install aws-sdk, nanoid, & dotenv. In a terminal at the root of your project, run the following commands: ` ENV - Environment Variables You'll need to provision an access key / secret for an IAM user that we'll use to authenticate our API calls. One of the benefits of running these calls on the server is you're able to protect your application secret through environment variables, instead of having to ship them to the client, which is not recommended. There are quite a few ways to log into AWS on your local machine, but just to keep everything inside of our project, let's create a .env file at the root of our project, and fill in the following keys with your own values: ` NOTE: One little gotcha here is that the more common AWS_ACCESS_KEY_ID is a reserved environment keyword used by the Netlify process. So if we want to pass around env variables, we'll have to use our own key, in this case prefixed with MY_. Once they're added to the process, we can destructure them and use in setting up our AWS SDK. We'll need to setup AWS for every CRUD function, so let's assemble all this logic in a separate file called dyno-client.js. ` The following is required. SDK - Software Developer Kit Using the aws-sdk makes our life a lot easier for connecting to DynamoDB from our codebase. We can create an instance of the Dynamo client that we'll use for the remaining examples: ` To make this available to all our functions, add the DynamoDB instance to your exports, and we'll grab it when we need it: ` Create Todo (Due by EOD 😂) ⚡ We're finally ready to create our API function! In the following example, we'll post back form data containing the text for our todo item. We can parse the form data into JSON, and transform it into an item to insert into our table. If it succeeds, we'll return the result with a status code of 200, and if it fails, we'll return the the error message along with the status code from the error itself. ` This should give you the gist of how to expose your API routes and logic to perform various operations. I'll hold off on more examples because most of the code here is actually just specific to DynamoDB, and we'll save that for a separate article. But the takeaway is that we're able to return something meaningful with very minimal plumbing. And that's the whole point! > With Functions, you *only* have to write your own business logic! Debugging - For Frictionless Feedback Loops There are two critical debugging tools in Visual Studio Code I like to use when working with node and API routes. 1. Script Debugger & 2. Rest Client Plugin ✨ Did you know, instead of configuring a custom launch.json file, you can run and attach debuggers directly onto npm scripts in the package.json file: And while tools like Postman are a valuable part of comprehensive test suite, you can add the REST Client Extension to invoke API commands directly within VS Code. We can easily use the browser to mock GET endpoints, but this makes it really easy to invoke other HTTP verbs, and post back form data. Just add a file like test.http to your project. *REST Client* supports expansion of variable environment, and custom variables. If you stub out multiple calls, you can separate multiple different calls by delimiting with ###. Add the following to your sample file: ` We can now run the above by clicking "Send Request". This should hit our Netlify dev server, and allow us to step through our function logic locally! Publishing Publishing to Netlify is easy as well. Make sure your project is committed, and pushed up to a git repository on GitHub, GitLab or BitBucket. Login to Netlify, and click the option to Create "New Site From Git" and select your repo. Netlify will prompt for a Build command, and a Publish directory. Believe it or not, we don't actually have either of those things yet, and it's probably a project for another day to set up our front end. Those commands refer to the static site build part of the deployment. Everything we need to build serverless functions is inside our functions directory and our netlify.toml config. Once we deploy the site, the last thing we'll need to do is add our environment variables to Netlify under Build > Environment Next Steps - This is only the beginning Hopefully some ideas are spinning as to how you can use these technologies on your own sites and projects. The focus of this article is on building and debugging Netlify functions, but an important exercise left to the reader is to take advantage of that on your front end. TIP: If you want to add Create React App to your current directory (without creating a new folder), add a . when scaffolding out a new app like this: ` Try it out - build a front end, and let me know how it goes at KyleMitBTV! For more context, you can browse the full source code for the article on GitHub at KyleMit/netlify-functions-demo. For even more practical examples with actual code, checkout the following resources as well! * David Wells - Netlify Serverless Functions Workshop * netlify/functions - Community Functions Examples Good luck, and go build things!...

The Importance of a Scientific Mindset in Software Engineering: Part 2 (Debugging) cover image

The Importance of a Scientific Mindset in Software Engineering: Part 2 (Debugging)

The Importance of a Scientific Mindset in Software Engineering: Part 2 (Debugging) In the first part of my series on the importance of a scientific mindset in software engineering, we explored how the principles of the scientific method can help us evaluate sources and make informed decisions. Now, we will focus on how these principles can help us tackle one of the most crucial and challenging tasks in software engineering: debugging. In software engineering, debugging is often viewed as an art - an intuitive skill honed through experience and trial and error. In a way, it is - the same as a GP, even a very evidence-based one, will likely diagnose most of their patients based on their experience and intuition and not research scientific literature every time; a software engineer will often rely on their experience and intuition to identify and fix common bugs. However, an internist faced with a complex case will likely not be able to rely on their intuition alone and must apply the scientific method to diagnose the patient. Similarly, a software engineer can benefit from using the scientific method to identify and fix the problem when faced with a complex bug. From that perspective, treating engineering challenges like scientific inquiries can transform the way we tackle problems. Rather than resorting to guesswork or gut feelings, we can apply the principles of the scientific method—forming hypotheses, designing controlled experiments, gathering and evaluating evidence—to identify and eliminate bugs systematically. This approach, sometimes referred to as "scientific debugging," reframes debugging from a haphazard process into a structured, disciplined practice. It encourages us to be skeptical, methodical, and transparent in our reasoning. For instance, as Andreas Zeller notes in the book _Why Programs Fail_, the key aspect of scientific debugging is its explicitness: Using the scientific method, you make your assumptions and reasoning explicit, allowing you to understand your assumptions and often reveals hidden clues that can lead to the root cause of the problem on hand. Note: If you'd like to read an excerpt from the book, you can find it on Embedded.com. Scientific Debugging At its core, scientific debugging applies the principles of the scientific method to the process of finding and fixing software defects. Rather than attempting random fixes or relying on intuition, it encourages engineers to move systematically, guided by data, hypotheses, and controlled experimentation. By adopting debugging as a rigorous inquiry, we can reduce guesswork, speed up the resolution process, and ensure that our fixes are based on solid evidence. Just as a scientist begins with a well-defined research question, a software engineer starts by identifying the specific symptom or error condition. For instance, if our users report inconsistencies in the data they see across different parts of the application, our research question could be: _"Under what conditions does the application display outdated or incorrect user data?"_ From there, we can follow a structured debugging process that mirrors the scientific method: - 1. Observe and Define the Problem: First, we need to clearly state the bug's symptoms and the environment in which it occurs. We should isolate whether the issue is deterministic or intermittent and identify any known triggers if possible. Such a structured definition serves as the groundwork for further investigation. - 2. Formulate a Hypothesis: A hypothesis in debugging is a testable explanation for the observed behavior. For instance, you might hypothesize: _"The data inconsistency occurs because a caching layer is serving stale data when certain user profiles are updated."_ The key is that this explanation must be falsifiable; if experiments don't support the hypothesis, it must be refined or discarded. - 3. Collect Evidence and Data: Evidence often includes logs, system metrics, error messages, and runtime traces. Similar to reviewing primary sources in academic research, treat your raw debugging data as crucial evidence. Evaluating these data points can reveal patterns. In our example, such patterns could be whether the bug correlates with specific caching mechanisms, increased memory usage, or database query latency. During this step, it's essential to approach data critically, just as you would analyze the quality and credibility of sources in a research literature review. Don't forget that even logs can be misleading, incomplete, or even incorrect, so cross-referencing multiple sources is key. - 4. Design and Run Experiments: Design minimal, controlled tests to confirm or refute your hypothesis. In our example, you may try disabling or shortening the cache's time-to-live (TTL) to see if more recent data is displayed correctly. By manipulating one variable at a time - such as cache invalidation intervals - you gain clearer insights into causation. Tools such as profilers, debuggers, or specialized test harnesses can help isolate factors and gather precise measurements. - 5. Analyze Results and Refine Hypotheses: If the experiment's outcome doesn't align with your hypothesis, treat it as a stepping stone, not a dead end. Adjust your explanation, form a new hypothesis, or consider additional variables (for example, whether certain API calls bypass caching). Each iteration should bring you closer to a better understanding of the bug's root cause. Remember, the goal is not to prove an initial guess right but to arrive at a verifiable explanation. - 6. Implement and Verify the Fix: Once you're confident in the identified cause, you can implement the fix. Verification doesn't stop at deployment - re-test under the same conditions and, if possible, beyond them. By confirming the fix in a controlled manner, you ensure that the solution is backed by evidence rather than wishful thinking. - Personally, I consider implementing end-to-end tests (e.g., with Playwright) that reproduce the bug and verify the fix to be a crucial part of this step. This both ensures that the bug doesn't reappear in the future due to changes in the codebase and avoids possible imprecisions of manual testing. Now, we can explore these steps in more detail, highlighting how the scientific method can guide us through the debugging process. Establishing Clear Debugging Questions (Formulating a Hypothesis) A hypothesis is a proposed explanation for a phenomenon that can be tested through experimentation. In a debugging context, that phenomenon is the bug or issue you're trying to resolve. Having a clear, falsifiable statement that you can prove or disprove ensures that you stay focused on the real problem rather than jumping haphazardly between possible causes. A properly formulated hypothesis lets you design precise experiments to evaluate whether your explanation holds true. To formulate a hypothesis effectively, you can follow these steps: 1. Clearly Identify the Symptom(s) Before forming any hypothesis, pin down the specific issue users are experiencing. For instance: - "Users intermittently see outdated profile information after updating their accounts." - "Some newly created user profiles don't reflect changes in certain parts of the application." Having a well-defined problem statement keeps your hypothesis focused on the actual issue. Just like a research question in science, the clarity of your symptom definition directly influences the quality of your hypothesis. 2. Draft a Tentative Explanation Next, convert your symptom into a statement that describes a _possible root cause_, such as: - "Data inconsistency occurs because the caching layer isn't invalidating or refreshing user data properly when profiles are updated." - "Stale data is displayed because the cache timeout is too long under certain load conditions." This step makes your assumption about the root cause explicit. As with the scientific method, your hypothesis should be something you can test and either confirm or refute with data or experimentation. 3. Ensure Falsifiability A valid hypothesis must be falsifiable - meaning it can be proven _wrong_. You'll struggle to design meaningful experiments if a hypothesis is too vague or broad. For example: - Not Falsifiable: "Occasionally, the application just shows weird data." - Falsifiable: "Users see stale data when the cache is not invalidated within 30 seconds of profile updates." Making your hypothesis specific enough to fail a test will pave the way for more precise debugging. 4. Align with Available Evidence Match your hypothesis to what you already know - logs, stack traces, metrics, and user reports. For example: - If logs reveal that cache invalidation events aren't firing, form a hypothesis explaining why those events fail or never occur. - If metrics show that data served from the cache is older than the configured TTL, hypothesize about how or why the TTL is being ignored. If your current explanation contradicts existing data, refine your hypothesis until it fits. 5. Plan for Controlled Tests Once you have a testable hypothesis, figure out how you'll attempt to _disprove_ it. This might involve: - Reproducing the environment: Set up a staging/local system that closely mimics production. For instance with the same cache layer configurations. - Varying one condition at a time: For example, only adjust cache invalidation policies or TTLs and then observe how data freshness changes. - Monitoring metrics: In our example, such monitoring would involve tracking user profile updates, cache hits/misses, and response times. These metrics should lead to confirming or rejecting your explanation. These plans become your blueprint for experiments in further debugging stages. Collecting and Evaluating Evidence After formulating a clear, testable hypothesis, the next crucial step is to gather data that can either support or refute it. This mirrors how scientists collect observations in a literature review or initial experiments. 1. Identify "Primary Sources" (Logs, Stack Traces, Code History): - Logs and Stack Traces: These are your direct pieces of evidence - treat them like raw experimental data. For instance, look closely at timestamps, caching-related events (e.g., invalidation triggers), and any error messages related to stale reads. - Code History: Look for related changes in your source control, e.g. using Git bisect. In our example, we would look for changes to caching mechanisms or references to cache libraries in commits, which could pinpoint when the inconsistency was introduced. Sometimes, reverting a commit that altered cache settings helps confirm whether the bug originated there. 2. Corroborate with "Secondary Sources" (Documentation, Q&A Forums): - Documentation: Check official docs for known behavior or configuration details that might differ from your assumptions. - Community Knowledge: Similar issues reported on GitHub or StackOverflow may reveal known pitfalls in a library you're using. 3. Assess Data Quality and Relevance: - Look for Patterns: For instance, does stale data appear only after certain update frequencies or at specific times of day? - Check Environmental Factors: For instance, does the bug happen only with particular deployment setups, container configurations, or memory constraints? - Watch Out for Biases: Avoid seeking only the data that confirms your hypothesis. Look for contradictory logs or metrics that might point to other root causes. You keep your hypothesis grounded in real-world system behavior by treating logs, stack traces, and code history as primary data - akin to raw experimental results. This evidence-first approach reduces guesswork and guides more precise experiments. Designing and Running Experiments With a hypothesis in hand and evidence gathered, it's time to test it through controlled experiments - much like scientists isolate variables to verify or debunk an explanation. 1. Set Up a Reproducible Environment: - Testing Environments: Replicate production conditions as closely as possible. In our example, that would involve ensuring the same caching configuration, library versions, and relevant data sets are in place. - Version Control Branches: Use a dedicated branch to experiment with different settings or configuration, e.g., cache invalidation strategies. This streamlines reverting changes if needed. 2. Control Variables One at a Time: - For instance, if you suspect data inconsistency is tied to cache invalidation events, first adjust only the invalidation timeout and re-test. - Or, if concurrency could be a factor (e.g., multiple requests updating user data simultaneously), test different concurrency levels to see if stale data issues become more pronounced. 3. Measure and Record Outcomes: - Automated Tests: Tests provide a great way to formalize and verify your assumptions. For instance, you could develop tests that intentionally update user profiles and check if the displayed data matches the latest state. - Monitoring Tools: Monitor relevant metrics before, during, and after each experiment. In our example, we might want to track cache hit rates, TTL durations, and query times. - Repeat Trials: Consistency across multiple runs boosts confidence in your findings. 4. Validate Against a Baseline: - If baseline tests manifest normal behavior, but your experimental changes manifest the bug, you've isolated the variable causing the issue. E.g. if the baseline tests show that data is consistently fresh under normal caching conditions but your experimental changes cause stale data. - Conversely, if your change eliminates the buggy behavior, it supports your hypothesis - e.g. that the cache configuration was the root cause. Each experiment outcome is a data point supporting or contradicting your hypothesis. Over time, these data points guide you toward the true cause. Analyzing Results and Iterating In scientific debugging, an unexpected result isn't a failure - it's valuable feedback that brings you closer to the right explanation. 1. Compare Outcomes to the hypothesis. For instance: - Did user data stay consistent after you reduced the cache TTL or fixed invalidation logic? - Did logs show caching events firing as expected, or did they reveal unexpected errors? - Are there only partial improvements that suggest multiple overlapping issues? 2. Incorporate Unexpected Observations: - Sometimes, debugging uncovers side effects - e.g. performance bottlenecks exposed by more frequent cache invalidations. Note these for future work. - If your hypothesis is disproven, revise it. For example, the cache may only be part of the problem, and a separate load balancer setting also needs attention. 3. Avoid Confirmation Bias: - Don't dismiss contrary data. For instance, if you see evidence that updates are fresh in some modules but stale in others, you may have found a more nuanced root cause (e.g., partial cache invalidation). - Consider other credible explanations if your teammates propose them. Test those with the same rigor. 4. Decide If You Need More Data: - If results aren't conclusive, add deeper instrumentation or enable debug modes to capture more detailed logs. - For production-only issues, implement distributed tracing or sampling logs to diagnose real-world usage patterns. 5. Document Each Iteration: - Record the results of each experiment, including any unexpected findings or new hypotheses that arise. - Through iterative experimentation and analysis, each cycle refines your understanding. By letting evidence shape your hypothesis, you ensure that your final conclusion aligns with reality. Implementing and Verifying the Fix Once you've identified the likely culprit - say, a misconfigured or missing cache invalidation policy - the next step is to implement a fix and verify its resilience. 1. Implementing the Change: - Scoped Changes: Adjust just the component pinpointed in your experiments. Avoid large-scale refactoring that might introduce other issues. - Code Reviews: Peer reviews can catch overlooked logic gaps or confirm that your changes align with best practices. 2. Regression Testing: - Re-run the same experiments that initially exposed the issue. In our stale data example, confirm that the data remains fresh under various conditions. - Conduct broader tests - like integration or end-to-end tests - to ensure no new bugs are introduced. 3. Monitoring in Production: - Even with positive test results, real-world scenarios can differ. Monitor logs and metrics (e.g. cache hit rates, user error reports) closely post-deployment. - If the buggy behavior reappears, revisit your hypothesis or consider additional factors, such as unpredicted user behavior. 4. Benchmarking and Performance Checks (If Relevant): - When making changes that affect the frequency of certain processes - such as how often a cache is refreshed - be sure to measure the performance impact. Verify you meet any latency or resource usage requirements. - Keep an eye on the trade-offs: For instance, more frequent cache invalidations might solve stale data but could also raise system load. By systematically verifying your fix - similar to confirming experimental results in research - you ensure that you've addressed the true cause and maintained overall software stability. Documenting the Debugging Process Good science relies on transparency, and so does effective debugging. Thorough documentation guarantees your findings are reproducible and valuable to future team members. 1. Record Your Hypothesis and Experiments: - Keep a concise log of your main hypothesis, the tests you performed, and the outcomes. - A simple markdown file within the repo can capture critical insights without being cumbersome. 2. Highlight Key Evidence and Observations: - Note the logs or metrics that were most instrumental - e.g., seeing repeated stale cache hits 10 minutes after updates. - Document any edge cases discovered along the way. 3. List Follow-Up Actions or Potential Risks: - If you discover additional issues - like memory spikes from more frequent invalidation - note them for future sprints. - Identify parts of the code that might need deeper testing or refactoring to prevent similar issues. 4. Share with Your Team: - Publish your debugging report on an internal wiki or ticket system. A well-documented troubleshooting narrative helps educate other developers. - Encouraging open discussion of the debugging process fosters a culture of continuous learning and collaboration. By paralleling scientific publication practices in your documentation, you establish a knowledge base to guide future debugging efforts and accelerate collective problem-solving. Conclusion Debugging can be as much a rigorous, methodical exercise as an art shaped by intuition and experience. By adopting the principles of scientific inquiry - forming hypotheses, designing controlled experiments, gathering evidence, and transparently documenting your process - you make your debugging approach both systematic and repeatable. The explicitness and structure of scientific debugging offer several benefits: - Better Root-Cause Discovery: Structured, hypothesis-driven debugging sheds light on the _true_ underlying factors causing defects rather than simply masking symptoms. - Informed Decisions: Data and evidence lead the way, minimizing guesswork and reducing the chance of reintroducing similar issues. - Knowledge Sharing: As in scientific research, detailed documentation of methods and outcomes helps others learn from your process and fosters a collaborative culture. Ultimately, whether you are diagnosing an intermittent crash or chasing elusive performance bottlenecks, scientific debugging brings clarity and objectivity to your workflow. By aligning your debugging practices with the scientific method, you build confidence in your solutions and empower your team to tackle complex software challenges with precision and reliability. But most importantly, do not get discouraged by the number of rigorous steps outlined above or by the fact you won't always manage to follow them all religiously. Debugging is a complex and often frustrating process, and it's okay to rely on your intuition and experience when needed. Feel free to adapt the debugging process to your needs and constraints, and as long as you keep the scientific mindset at heart, you'll be on the right track....

Let's innovate together!

We're ready to be your trusted technical partners in your digital innovation journey.

Whether it's modernization or custom software solutions, our team of experts can guide you through best practices and how to build scalable, performant software that lasts.

Prefer email? hi@thisdot.co