This article was written over 18 months ago and may contain information that is out of date. Some content may still be relevant, but please refer to official documentation for the latest information.
The Firebase suite includes multiple products, about which you can read more here. In this article, however, I'm going to talk about the Performance Monitoring product.
I'm going to show you how to use it in an Angular app, but the process for React, VueJS, etc, is very very similar.
Thanks to this product, you can observe the performance of your app. By using the product, you see the areas for improvement in your code. This product can help you avoid crashes by increasing your code quality.
Note: I'm assuming you have a Firebase account, and any project there that can be used throughout this article
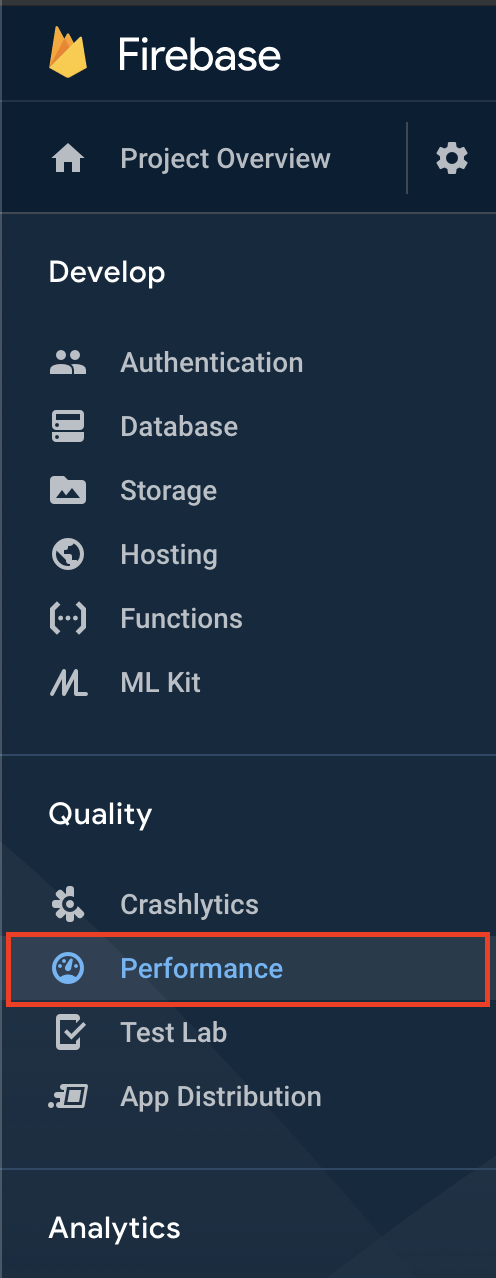
On the left navbar, inside of a Firebase console, you will see Performance. Click it. This is where your data will be populated after 12-24hrs of monitoring.
Now, go to project settings:
Then, scroll all the way down, and copy/paste the JSON with all your project settings in a safe place. If you don't see those settings as shown on the screenshot, you might need to register a new web-app for the current project (instructions on how to do this are given on the same page in Project settings > General).
Navigate to your project directory in the command line, and run:
npm install firebase @angular/fire --save
5)Import the Firebase modules in your app.module.ts
Note: In order to see your app performance, you need to deploy your app and give Firebase approximately 24 hours to collect some data.
Go back to Firebase-> Performance Tab, you should see something like this:
You will see this dashboard showing some basic data per country, and per enviroment you have used your app.
Now, click on View Traces, and click on the enviroment you want to be the traces. You will see a metrics dashboard
If you click on View More, you will see more information about that specific metric. Check it out!
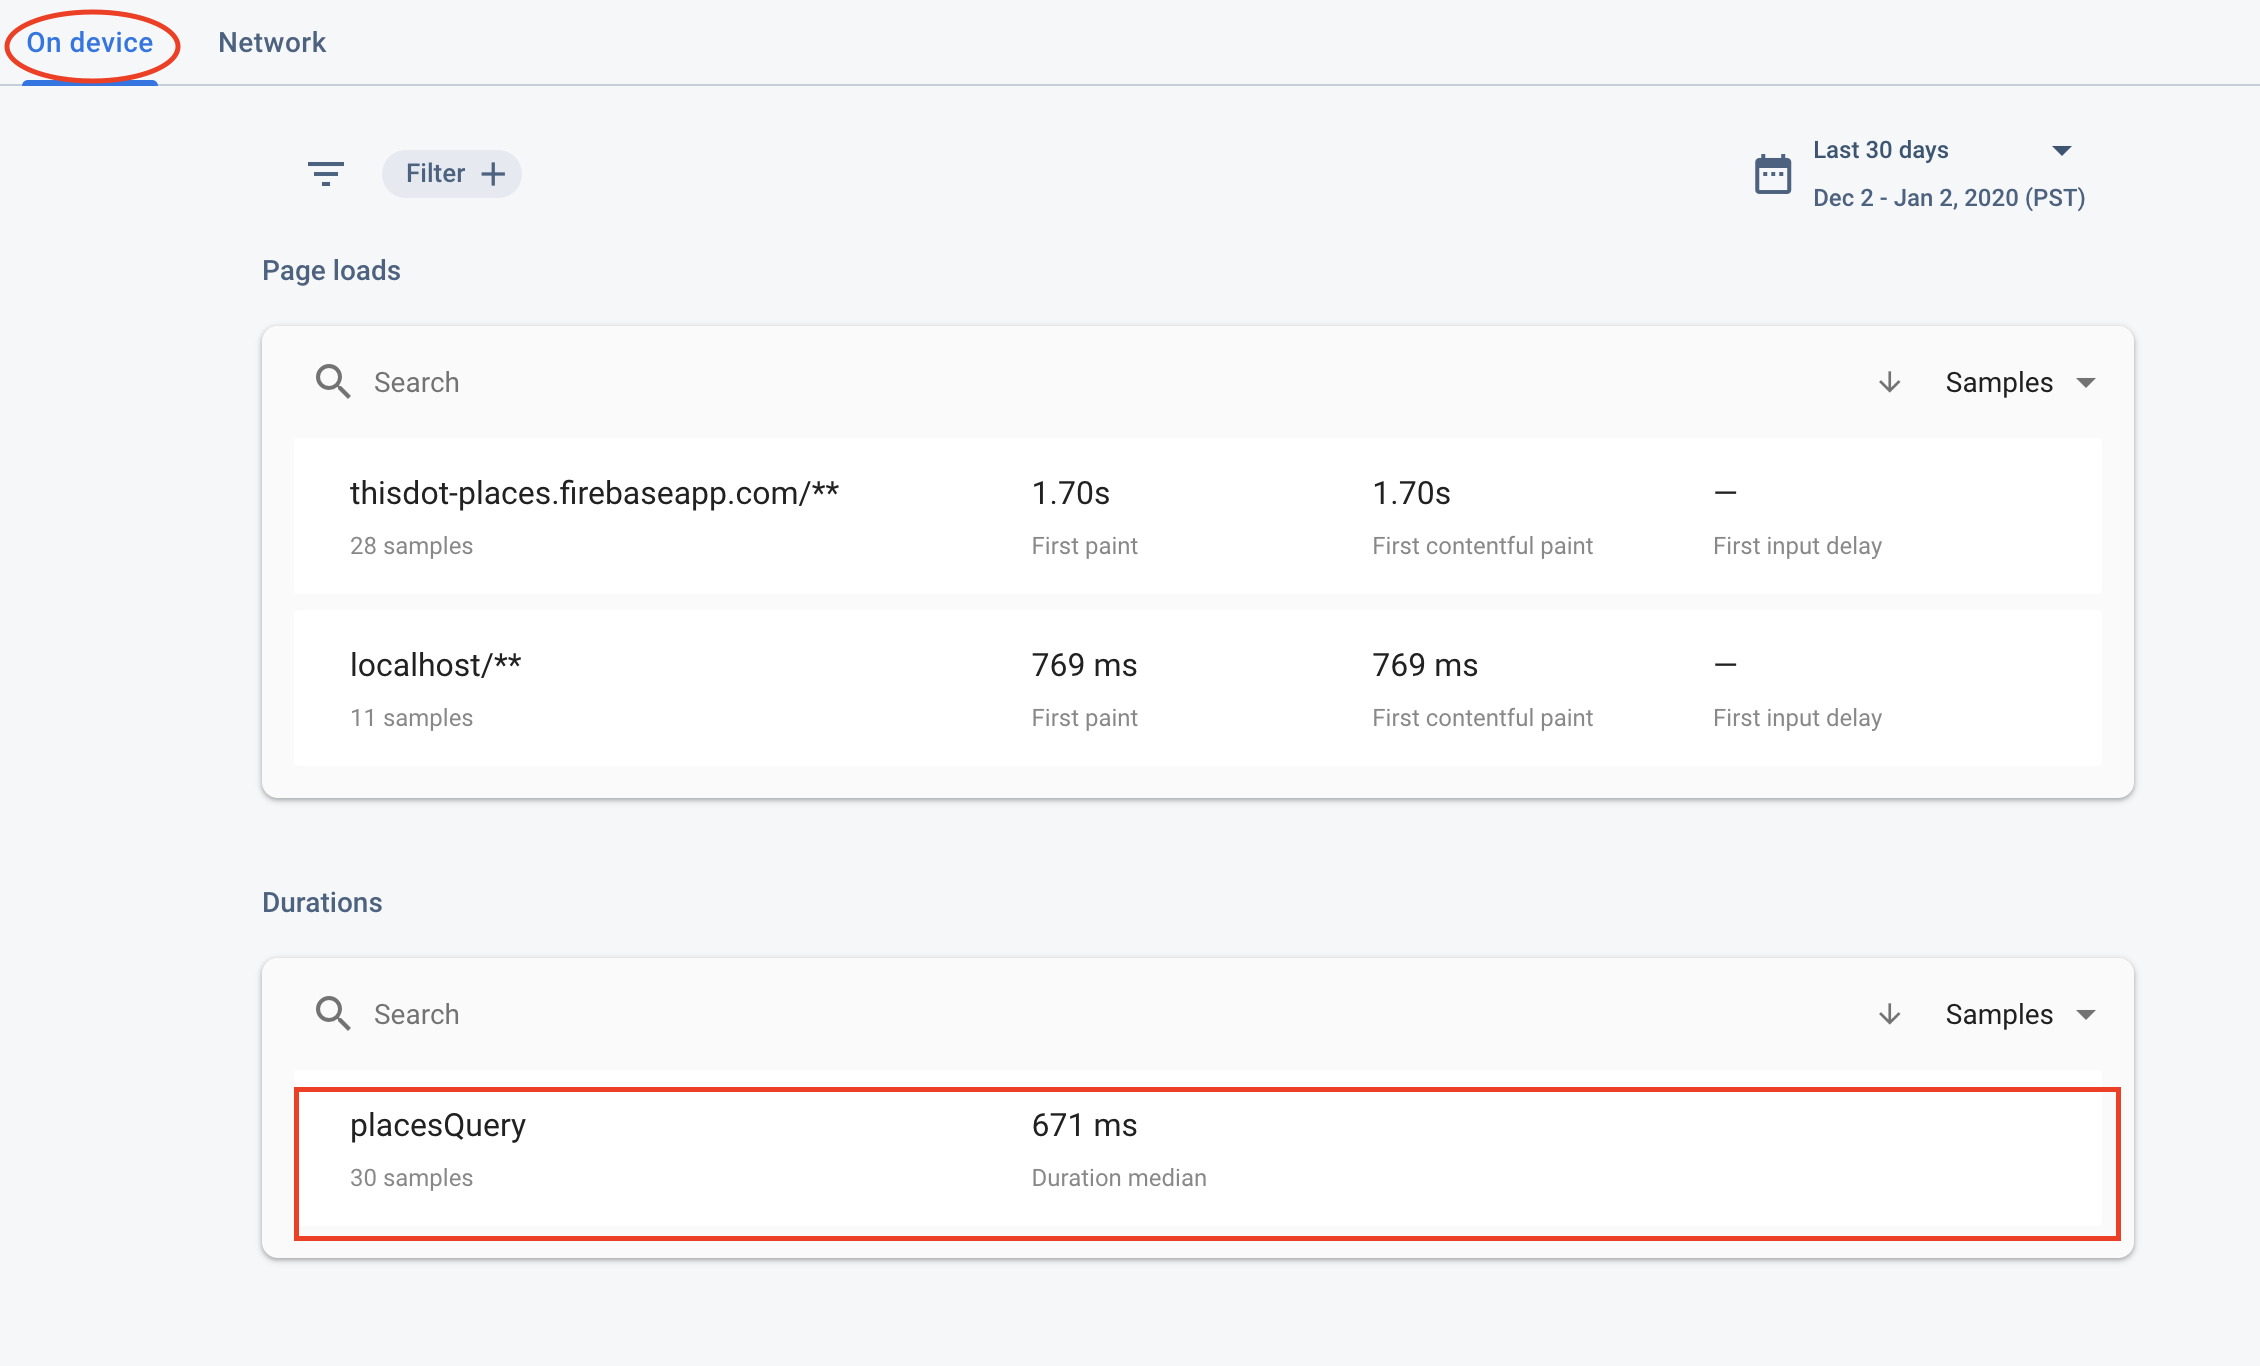
Now go back to the previous page and click on device tab. Then click on the trace you created to view the performance data. In my case, my custom trace is placeQuery.
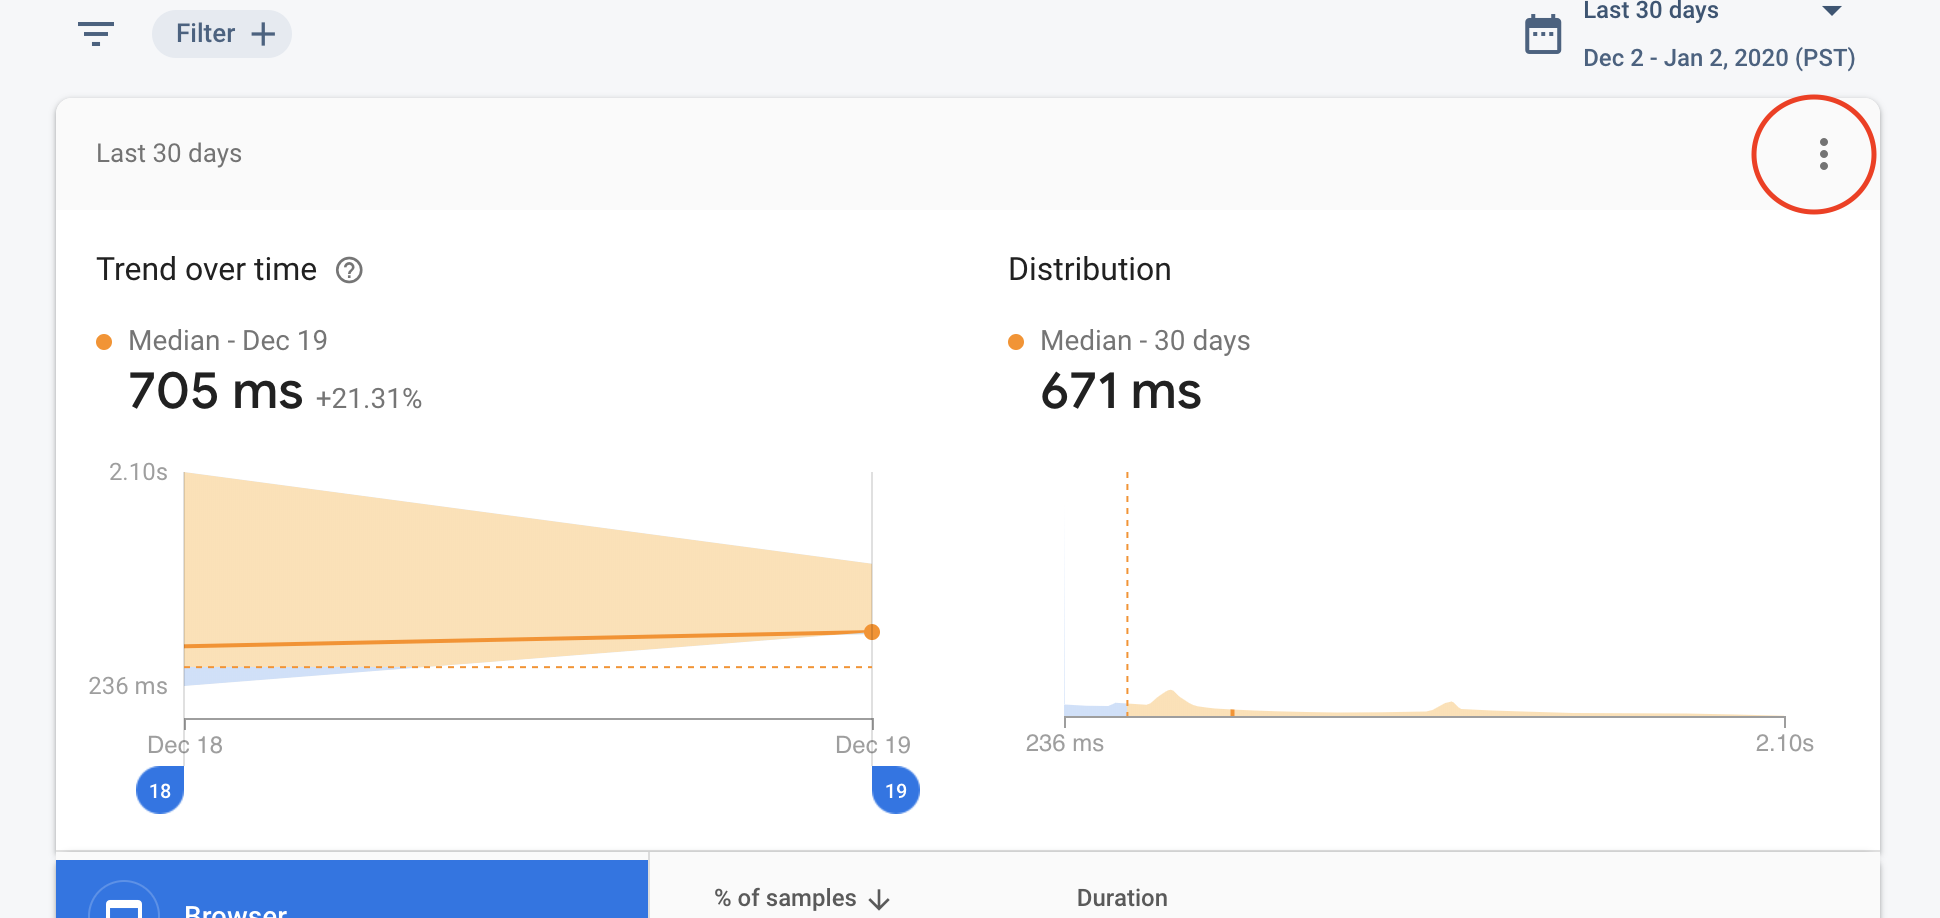
After clicking on the custom trace, you will see a dashboard that is similar to the one in the picture below. Click on View More.
After clicking on view more, you will see some specific traces realted to your custom trace.
As you can see, you have the option to see the metrics depending on different factors like the browser, country, etc.
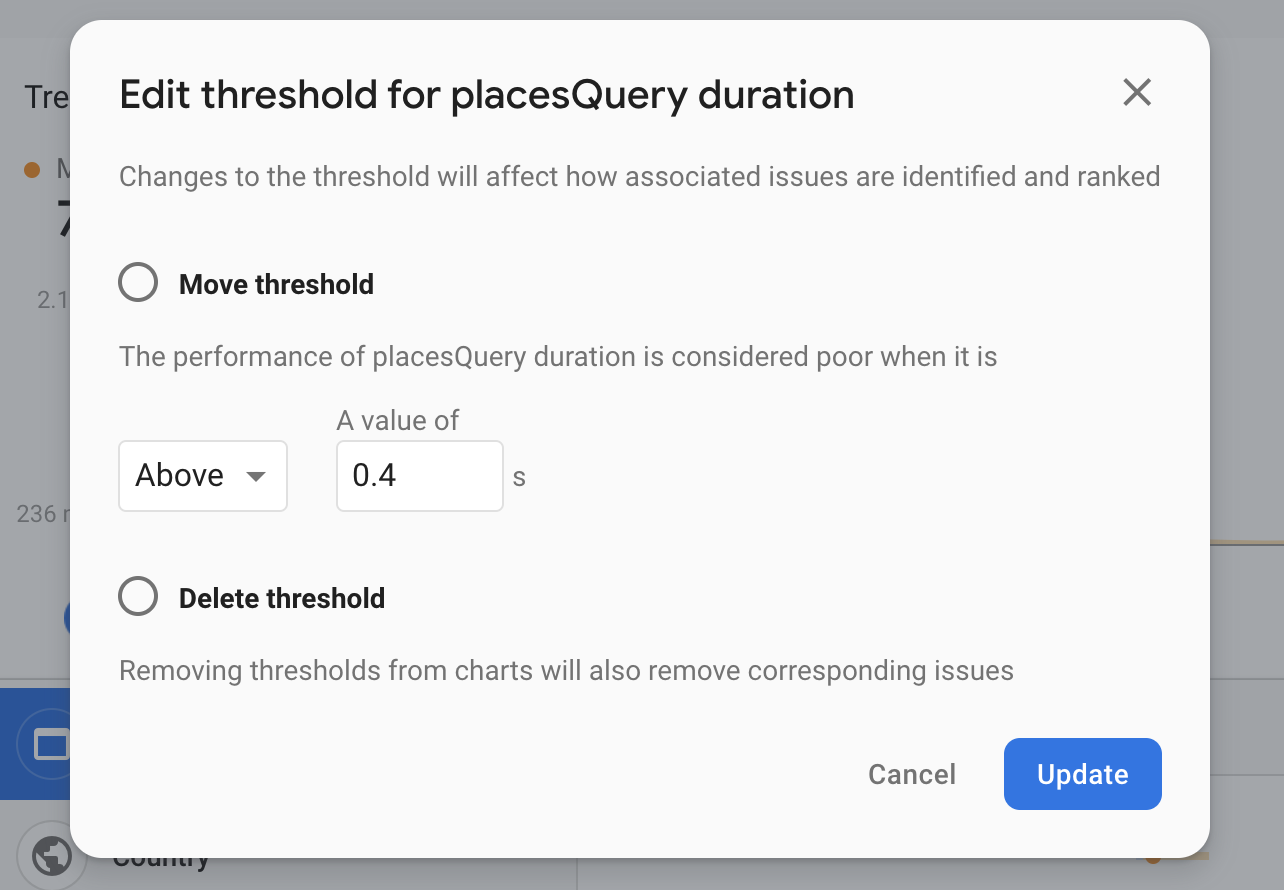
You can also set parameters to see when the performance on the page is below the average by setting a threshold.
All of these performance metrics will help you understand how your app performs in different conditions to improve the user experience for your customers.
About the author
Pato Vargas
Software Engineer
Google Developer Expert on Angular and Web Technologies, Google Women Techmaker Ambassador, Auth0 Ambassador, Media Developer Expert at Cloudinary, Platzi Master Coach, and SpringBoard mentor.