Applitools is a fully-packed automation framework for visual UI regression testing. Whether you’re already serious about visual UI testing and looking for an easy way to automate this type of testing for your web and mobile applications, or you’ve just started looking into visual UI testing techniques, you may want to give Applitools a try to discover the advantages this tool provides in terms of automating your visual UI tests with regression-testing at the core!
In this post, we introduce the features of Applitools. In particular, we explain how Applitools can be used with a variety of programming languages and technologies, and we shed light on the importance of visual regression testing. You will learn the unique ways Applitools facilitates the process of running regression tests, and how Applitools easily reports test results including visual discrepancies, which is something very difficult to automate effectively without the AI engine provided by Applitools.
UI Testing
With UI testing, you test the function of your web app via simulated user inputs. For instance, by using the Cypress.io testing framework, you can simulate user actions of opening a web browser, locating and clicking a button on the page, or even inputting some text into an input field. This works perfectly and can be a great aid to help test the UI side of your application by verifying the function of the pages and how they will perform in production.
However, UI functional testing is only one aspect of testing, and this alone is not enough to do a full visual test of your application. We must consider things such as changes in the layout, size, or location of the components on the page, changes in the text formatting or content, and many other visual changes that are more difficult to detect with traditional functional testing. This is especially true with responsive web applications that change layout based on the size of their viewport.
Hence, visual UI testing is inevitable and a must! Otherwise, unintended UI changes (change in CSS, content, etc.) will go unnoticed in your testing and affect your users.
Visual UI Testing
Automated visual UI testing is a form of regression testing that follows certain steps in order to validate that screens or pages have not changed unexpectedly from one test run to another. The figure below depicts a typical test case simulating a user’s actions for opening the “Wikipedia” website and searching for “Software” as a keyword.
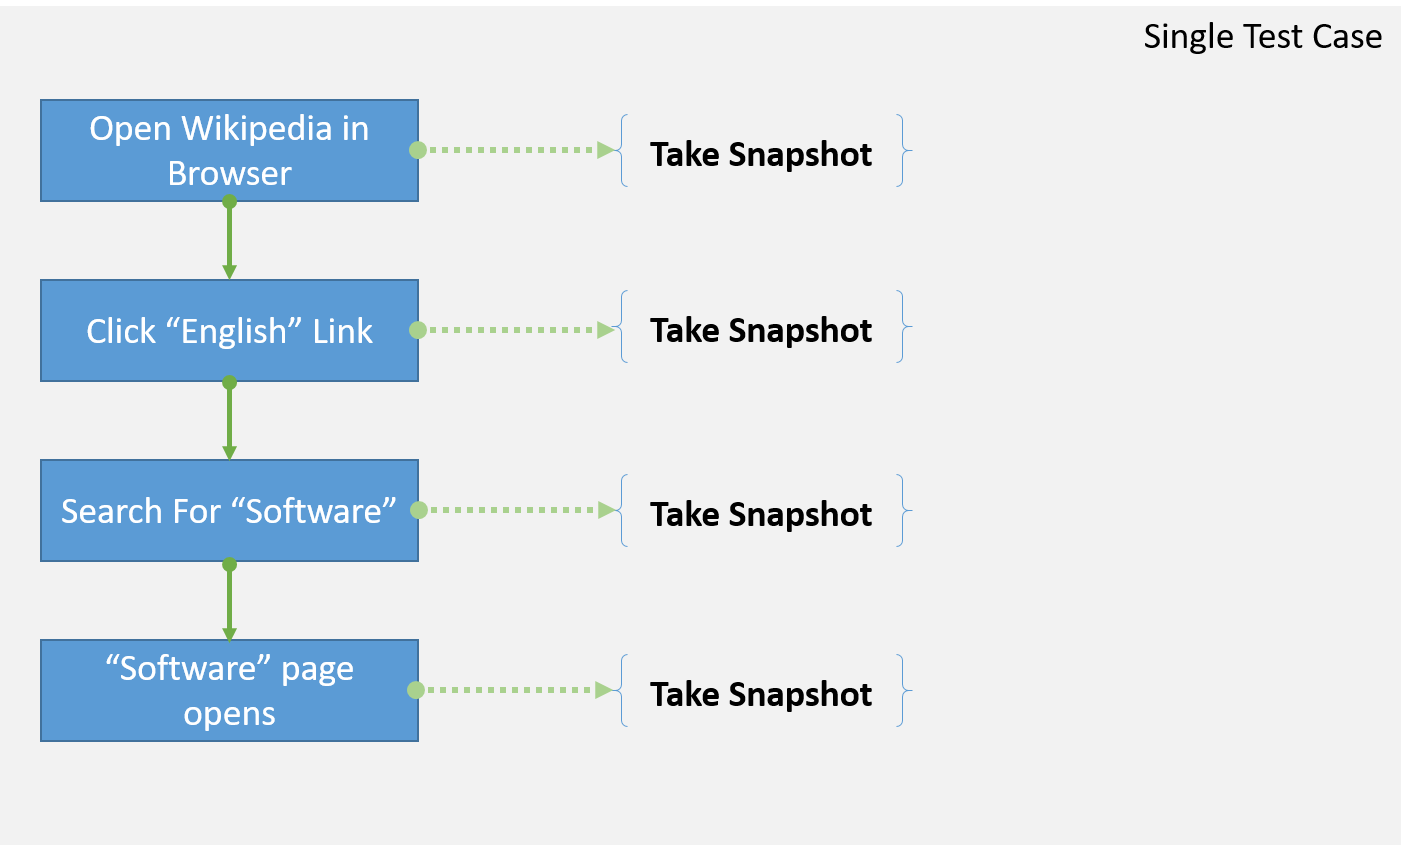
The process of doing visual UI testing starts by creating a typical integration test case using the same tools and test suites you would normally use in executing such integration tests. An integration test is a series of actions executed on the app screens/pages, simulating an actual user.
With visual UI testing, you follow the same steps as above but with a twist:
-
Open a browser and navigate to the “Wikipedia” website.
-
The step above creates a new state of a “Browser opening Wikipedia website”.
-
Take a snapshot of this state. If this is the first time the test case is running, then you will save this snapshot as a “baseline” for this step within the test case. This is also true for the other snapshot steps below.
-
Entering the “Software” keyword into the Search-box.
-
The step above creates a new state of “Wikipedia English website and the search-box field populated with the keyword Software”.
-
Take a snapshot of this state.
-
“Wikipedia” Software page opens.
-
The steps above create a new state of “Wikipedia Software page displayed for user”.
-
Take a snapshot of this state.
The next time you run the same test case again, upon taking a snapshot, you would compare the snapshot to the baseline and report the results. The results could be:
-
No change: In this case, the new snapshot is equivalent to the baseline snapshot.
-
Change: In this case, the new snapshot has some UI changes compared to the baseline snapshot.
The visual UI tester is now responsible for comparing the snapshots, analyzing them and deciding how to address any differences. They may accept the differences, save the new snapshot as the baseline and use it for the coming regression tests. Or, they may reject the differences and inform the developers of the bugs and issues noted by the results.
How Applitools works
Applitools uses the same approach as above by providing the tools that you can use to take snapshots, send snapshots to the Applitools cloud and run AI logic to compare the snapshots with their corresponding baselines.
Applitools provides a rich set of Software Development Kits (SDKs) for well-known test suites. For instance:
-
SDK for Cypress.io end-to-end testing framework (recently launched)
-
SDKs for Storybook with React, Angular and Vue (recently launched)
-
SDKs for almost all of the Selenium flavors (JavaScript, Java, C#, Ruby, etc.).
-
SDKs for almost all of the Appium flavors (Native C#, Native Java, Native PHP, etc.).
For instance, Applitools for Selenium SDK wraps the Selenium WebDriver and provides a new and enhanced WebDriver that you can use to simulate a user’s actions on a screen or page. The only difference is that Applitools is now aware of each and every action you execute on the Selenium WebDriver. This makes it easy for Applitools to capture snapshots of the results of an action executed against the WebDriver.
When using Applitools SDK in your test cases, you can ask the SDK to capture the state of the application whenever you want. This process is as follows:
-
The SDK takes a snapshot of the browser
-
The resultant snapshot is sent to the Applitools Server
-
If there is no previous baseline image, the Server stores the image as the baseline for comparison in future test runs
-
If there was a previous baseline image, the Server runs its AI engine to compare the baseline image to the new snapshot. The engine reports whether the images match, or the engine reports any discrepancies between the two images.
-
Upon completion of the tests, a detailed report is generated on the differences between the various snapshots and their corresponding baselines.
With the recent launch of Cypress.io and Storybook SDKs, Applitools took a new and enhanced approach to visual testing — the Applitools Visual Grid. Instead of snapshot images, DOM Snapshots are uploaded to the Applitools Servers, and these snapshots are now analyzed in parallel. The result is up to 30x improvement in the speed of your visual testing suite.
Applitools Test Manager
In addition, Applitools provides a rich Test Manager dashboard to help you manage all the tests you run. You can run multiple test cases within a single batch.
For each test case, you get a list of all the snapshots taken throughout the execution of the test case. The dashboard will notify you of any test cases that are unresolved, meaning the snapshots generated by the test case might be different from those stored as baselines. The dashboard provides the tools to mark those changes as accepted and updates them as the new baseline snapshot, or rejects the differences and marks those changes as bugs for the developers to address.
The Test Manager provides a variety of features to make the process of checking and validating test case results an easy one.
The powerful AI engine behind Applitools can use one of four pattern matching algorithms to compare the snapshots to their corresponding baselines. The algorithms are:
-
Exact: This is a pixel-to-pixel matching technique which is generally not recommended due to its strictness.
-
Strict: This matching technique compares everything including content (text), fonts, layout, colors and position of each of the elements. This mode ignores the rendering changes that are not visible to the human. You will generally get the best results with this mode of comparison.
-
Content: This option is similar to the strict option above except that it only performs content (text) comparisons.
-
Layout: This option is similar to the strict option above except that it only performs layout comparisons.
You can specify the matching strategy within the test case code itself or through the Test Manager when viewing the comparison results between the snapshots.
Screenshot API
In addition to selecting and using one of the available SDKs, Applitools provides the Screenshots API in a variety of programming languages that can help you in taking snapshots of anything in your application and sending those snapshots to the Applitools Server to process and generate comparison results.
The Screenshots APIs available are:
With a Snapshots API, you can easily send snapshots to the Applitools Server, run comparisons on the snapshots, and generate comparison results. Hence, the Snapshots API could be used as a general purpose gateway to access the AI engine sitting behind the Applitools Server.
Demo
Now let’s switch gears and get our hands dirty developing a simple test case making use of the Applitools SDK for Cypress.io.
In this test case, we will simulate the process of navigating to the “Wikipedia.com” website, clicking to the English version of the website, typing “Software” in the search-box field, and finally navigating to the “Software” page on Wikipedia.
Initialize NPM on a new folder
I will start by creating a new folder and initializing it with NPM to access the package.json file. Issue the following command and follow the steps required to generate the file:
npm init
Install Cypress package
The next step is to install the Cypress NPM package with its files and start testing your source code with Cypress. Issue the following command:
npm install cypress --save-dev
This command installs Cypress package as a dev dependency onto your project.
Now open Cypress and run it locally. Issue the following command:
npx cypress open
The first time you run this command, Cypress prompts you with a warning message that it is about to add some configuration files and sample tests to help you get started. It will appear like this.
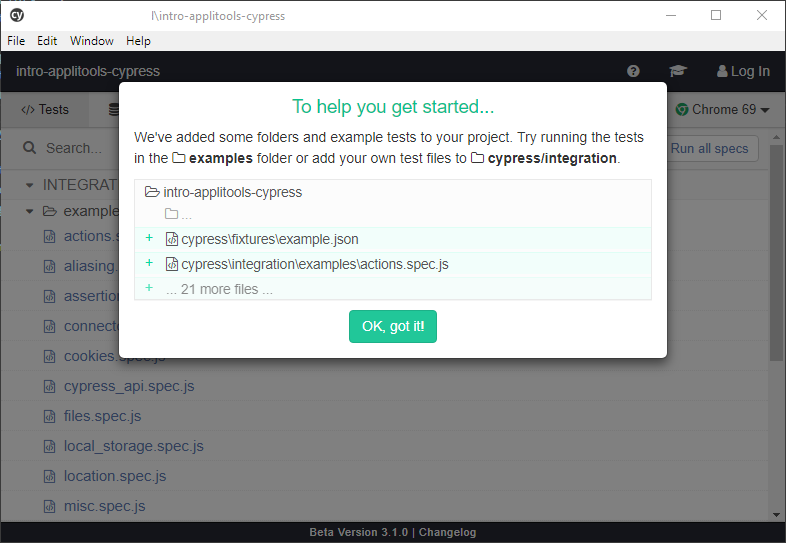
Click on Ok, got it! button to proceed and run Cypress locally. Two things happened here:
-
A new folder named cypress was created inside your project root folder with a few sub-folders inside following the structure of a typical Cypress folder-configuration system that is used to run your tests.
-
The Cypress Test Runner is now open and you can start playing around with the sample tests and run them.
Click on any of the tests and familiarize yourself on how Cypress runs tests in the browser.
Create our first test case
Let’s go ahead and create our first test case with Cypress. In the context of this article, I will assume you know how to write Cypress test cases. If for some reason you require additional information, you can visit the Cypress website and explore their detailed documentation by clicking on this link: Cypress Getting Started.
Let’s get going!
-
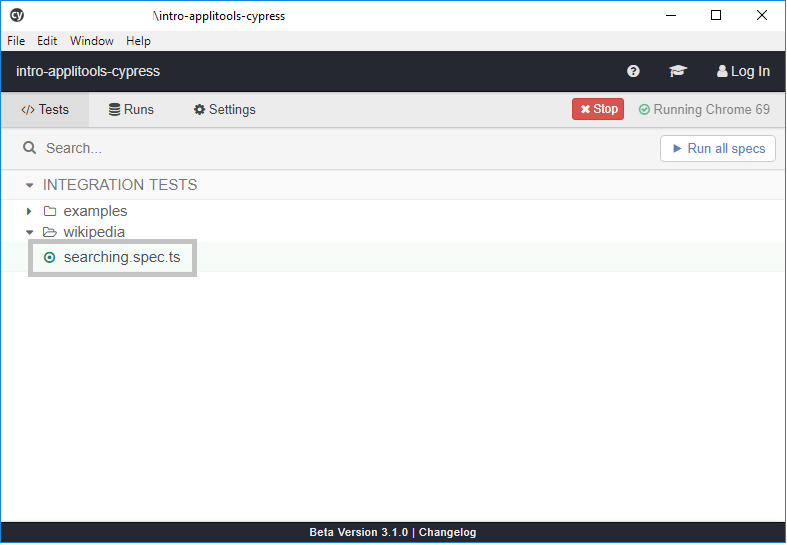
Add a new folder named Wikipedia under the cypress/integration folder.
-
Add a new JavaScript file named searching.spec.ts under the new folder you created.
-
Include the following source code inside the new file
/// <reference types=”Cypress” />

    context(‘Wikipedia’, () => {
      beforeEach(() => {
        // Go to Wikipedia website
        cy.visit(‘https://www.wikipedia.org/')
      });

      it(‘Go to Software page by searching for “Software”’, () => {
        // Find the “English” link and click it
        cy.get(‘#js-link-box-en’).click();

        // Find the search-box control and type “Software”
        cy.get(‘#searchInput’)
          .type(‘Software’) // Type “Software”
          .should(‘have.value’, ‘Software’) // Check for correct value
          .type(‘{enter}’); // press enter

        // check if the element has a class
        cy.get(‘#firstHeading’).should(‘have.class’, ‘firstHeading’);
      })
    })
Before each test case run, the code is instructing Cypress to visit the “Wikipedia” website. Our test case for this article verifies that when searching for “Software” on Wikipedia, the user is directed to the Software page there.
Notice, the code starts by finding the English link on the Wikipedia website and clicking it. Now, Wikipedia is in a state where the English version of its website is displayed to the user.
The test case locates the search-box input control, on the page, by its ID. Then, by using the powerful chaining/fluent Cypress API, it issues a command to type the text “Software” into the search-box input control. Then it makes sure the input control now holds the text of “Software”. Finally, it issues an Enter command to actually submit the search form.
The last line of code assumes that the user has been transferred to the English page on Wikipedia. It locates an HTML DIV by its ID and verifies that it has a CSS class of firstHeading.
The test case is fairly simple yet it gives you an idea on how you may use Cypress to write your functional/UI tests for your application.
Let’s run the tests by issuing the following command:
npx cypress open
On the Cypress Test Runner, locate the searching.spec.ts file and click on it.
Cypress runs the selected test and open a new instance of the Chrome (headless) browser to run all the commands in the test case.
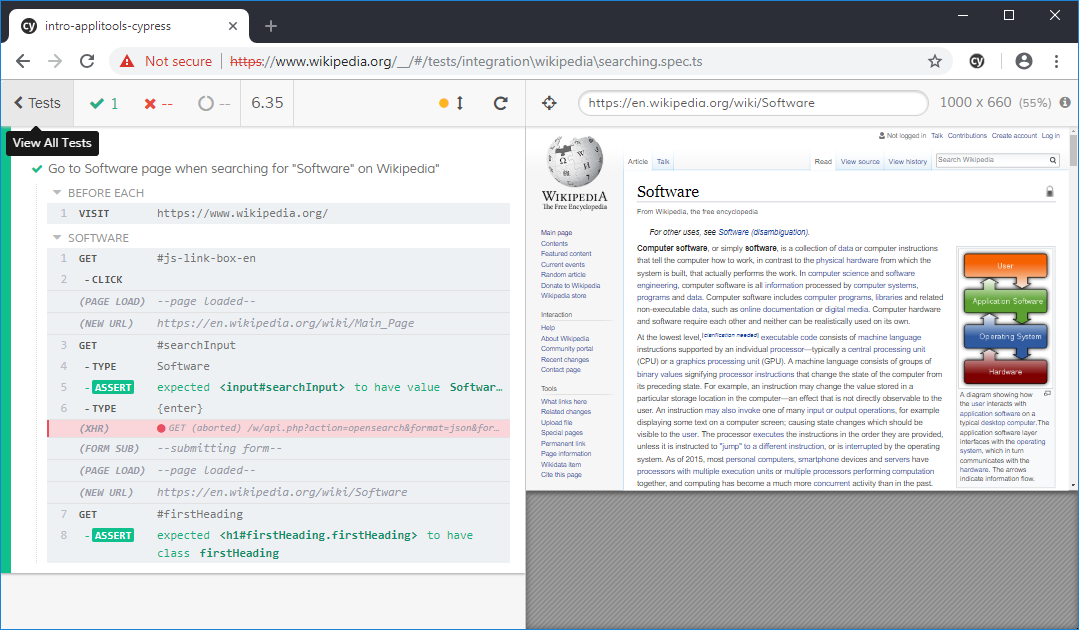
You may go through the test case steps on the left-hand side of the page and try replaying individual steps and watch how they get executed on the fly on the right-hand side of the page.
Now let’s add some visual UI testing with Applitools.
Add Applitools Cypress SDK to the mix
Let’s start by installing the Applitools Cypress SDK into our project. For that purpose, you can issue the following command:
npm install @applitools/eyes.cypress --save-dev
The npm command above installs the Applitools eyes.cypress plugin as a dev dependency on your project. (Eyes is the name of Applitools’ product.)
The next step is to configure the eyes.cypress plugin by issuing the following command:
npx eyes-setup
The npx command above adds the necessary imports to your cypress plugins and support files. You may read additional information on how to setup eyes.cypress in full detail by clicking on this link: @applitools/eyes.cypress.
In brief, the command added the following line of code to the plugins/index.js file:
require(‘@applitools/eyes.cypress’)(module);
In addition, the following line of code was also added to the support/index.js file:
import ‘@applitools/eyes.cypress/commands’
With these packages now installed on the project, you may start enjoying visual UI testing!
Let’s amend the test case with a few calls to the eyes.setup plugin to save snapshots for the different test case states and send them to the Applitools Servers.
    /// <reference types=”Cypress” />

    context(‘Wikipedia’, () => {
      beforeEach(() => {
        // Go to Wikipedia website
        cy.visit(‘https://www.wikipedia.org/')

        // Open a connection with Applitools Servers
        cy.eyesOpen({
          appName: ‘Intro to Applitools Cypress SDK’,
          testName: ‘Searching Wikipedia’,
          browser: { width: 800, height: 600 }
        });

        // Take a snapshot after the browser opens Wikipedia page
        cy.eyesCheckWindow(‘Wikipedia home page’);
      });

      afterEach(() => {
        // Close the connection with Applitools Servers
        cy.eyesClose();
      });

      it(‘Go to Software page when searching for “Software”’, () => {
        // Find the “English” link and click it
        cy.get(‘#js-link-box-en’).click();

        // Take a snapshot of Wikipedia English Page
        cy.eyesCheckWindow(‘Wikipedia English Page’);

        // Find the search-box control and type “Software”
        cy.get(‘#searchInput’)
          .type(‘Software’) // Type “Software”
          .should(‘have.value’, ‘Software’) // Check for correct value
          .type(‘{enter}’); // press enter

        // Take a snapshot of the Software Page on Wikipedia
        cy.eyesCheckWindow(‘Software Page on Wikipedia’);

        // check if the element has a class
        cy.get(‘#firstHeading’).should(‘have.class’, ‘firstHeading’);
      })
    })
The test case opens a connection to the Applitools Servers before running each and every test case using the following line of code:
    cy.eyesOpen({
      appName: ‘Intro to Applitools Cypress SDK’,
      testName: ‘Searching Wikipedia’,
      browser: { width: 800, height: 600 }
    });
The call to the eyesOpen() method specifies the name of the application, the name of the test case and the browser dimensions. You have plenty of properties to include on this method, and you may check them all by clicking on this link: @applitools/eyes.cypress.
The code then issues a command to the eyes.cypress plugin to take a snapshot of the current state of the test case.
    // Take a snapshot after the browser opens Wikipedia page
    cy.eyesCheckWindow(‘Wikipedia home page’);
The eyesCheckWindow() function takes as input the name of the snapshot and sends it instantaneously to the Applitools Servers.
After running each and every test case the code also closes the connection with the Applitools Servers:
    afterEach(() => {
      // Close the connection with Applitools Servers
      cy.eyesClose();
    });
In the body of the test case, I include several calls to the cy.eyesCheckWindow() function to collect a few snapshots for the different states of the test case.
As you can see, the process of using the eyes.cypress is fairly straightforward.
Let’s run the tests again by issuing the following command:
npx cypress open
You can follow on Cypress while it is running the test case.
Let’s review the results in the Applitools Test Manager.
Review the results in the Applitools Test Manager
Now that we run our visual/UI test case with Applitools Cypress SDK, let’s explore the Applitools Eyes Test Manager and see what happened here.
To log into the Test Manager sign-in at the Applitools website.
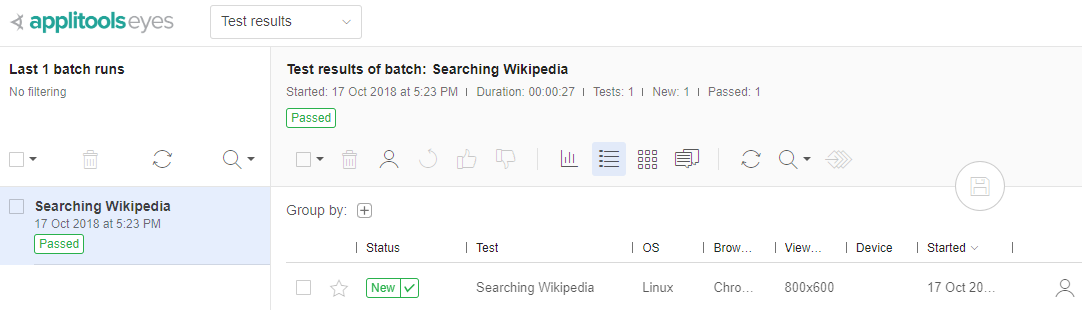
The image shown above is what you see when you log in to the Applitools Test Manager.
You notice a single batch on the left-hand side. This is the test case that we performed. Applitools can run multiple test cases in a single batch. In this case, we only have a single test case in the batch.
By clicking on the batch the Test Manager displays the test case(s) inside this batch on the right side of the screen.
The status of the test case is “New”, meaning this is the first time the test case was executed. Therefore, there are no previous baseline snapshots to compare against.
By clicking on the test case you can see all the snapshots that Applitools Cypress SDK took during the running of the test case.
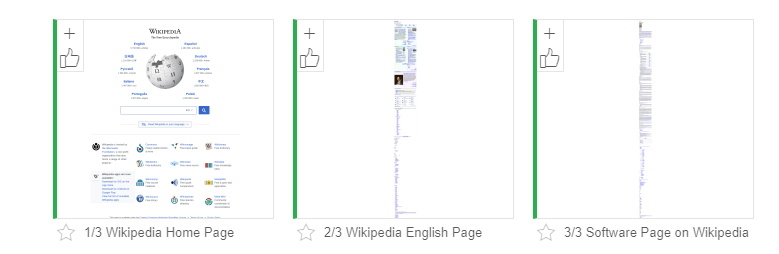
Clicking on the third snapshot, the dashboard expands the image so you can review it carefully.
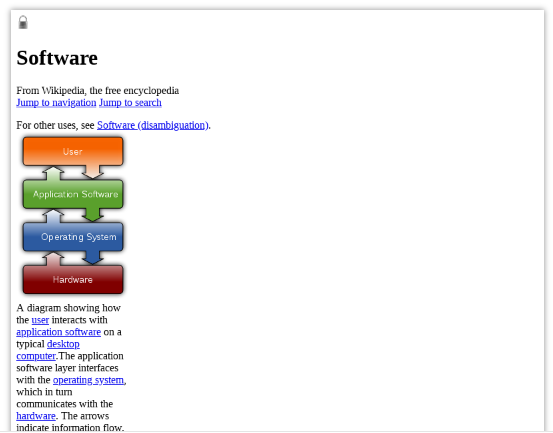
In general, when viewing a snapshot in the zoomed-mode, you get the chance to see the current snapshot on the right-hand side and the baseline (if any) on the left-hand side.
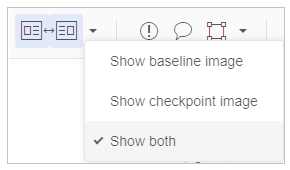
If you cannot see both snapshots, then you need to instruct the Test Manager to display both as shown in this figure:
Let’s run the test case once again, except this time, before running the test, we will change the search term in our test from “Software” to something else like “Applitools”. This will imitate the effect of having a visual regression in our test results that we would like Applitools to detect.
Run the tests and then visit the Test Manager and notice the following results.
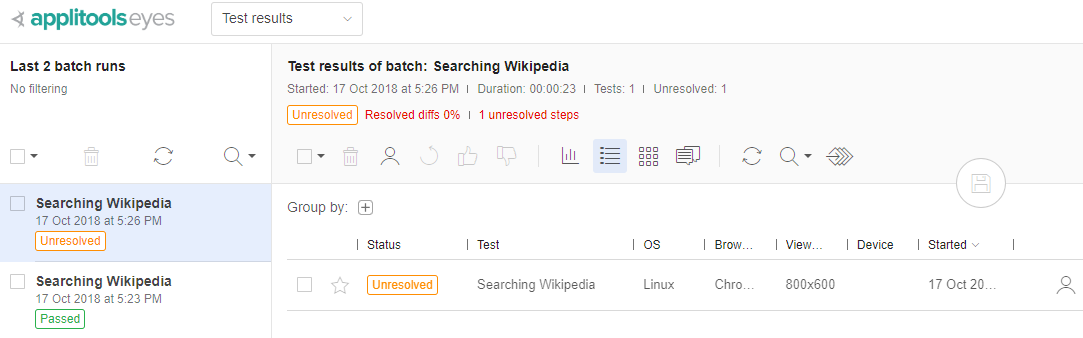
Now we can see the two batches that we ran. However, the second run of the same batch has a status of “Unresolved”. This means that the snapshots that were taken in the second batch have some differences compared to the baseline snapshots taken in the first run.
By clicking on the test case on the right-hand side of the screen you can see the following:
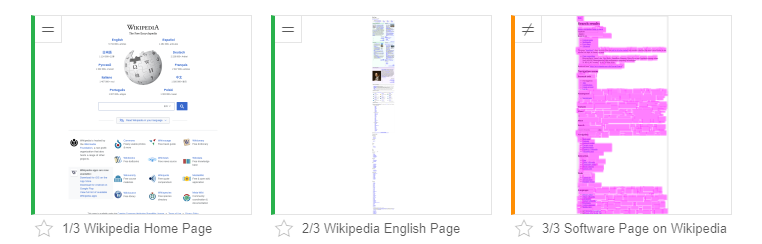
The Test Manager displays all of the snapshots in the test case. The third snapshot shows a difference between this one and the baseline snapshot. You may click on the third snapshot and view the differences.
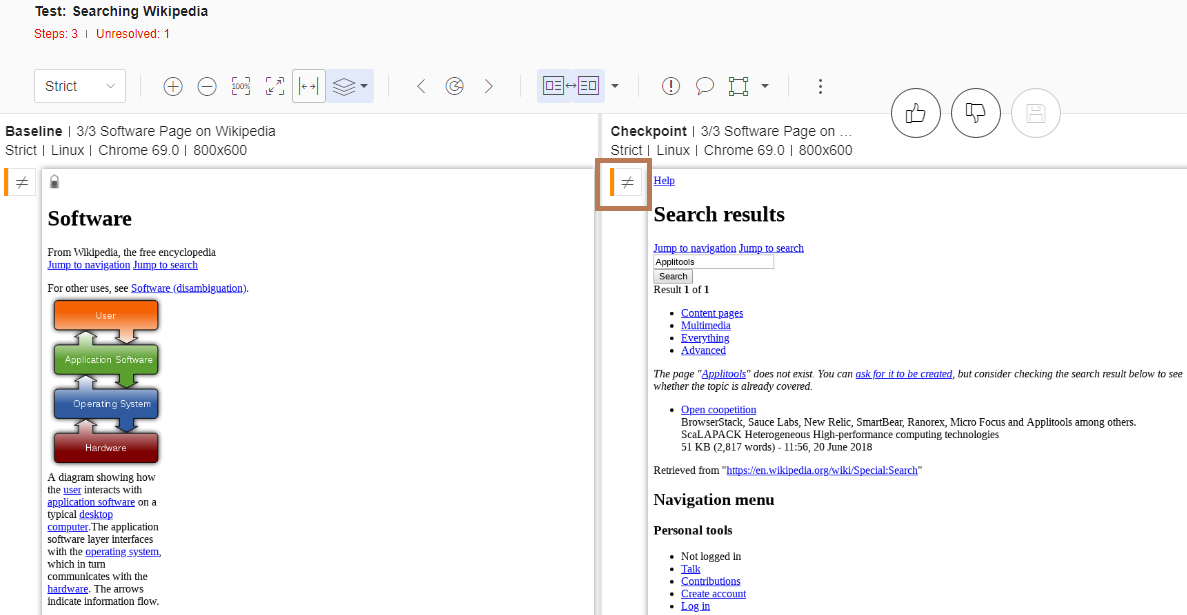
You can notice the Not Equal sign surrounded by a red rectangle (The rectangle added on the snapshot above to highlight this section). The sign clearly shows that the new snapshot is different from the baseline snapshot taken in a previous run for the test case. This demonstration simulates a regression testing cycle where things change (content or anything else) and with Applitools Test Manager you can detect the changes and report them.
This was just the tip of the iceberg in exploring the Test Manager. You may learn more about Applitools and the Test Manager by visiting the Applitools website.
Conclusion
In this article you have explored writing a UI/integration test case, converting the test case into a visual/UI test case using Applitools Cypress SDK, and using the Test Manager to study and analyze the results.
There is plenty of information about Applitools that I recommend you check on their website if you are really serious about adding visual UI testing to your projects.
Happy Applitooling!