Skip to content

Decomposing a project using Nx - Part 1

This article was written over 18 months ago and may contain information that is out of date. Some content may be relevant but please refer to the relevant official documentation or available resources for the latest information.

Decomposing a project using Nx - Part 1

Working on a large codebase brings multiple challenges that we need to deal with. One of them is how to manage the repository structure and keep it as clean and maintainable as possible. There are multiple different factors that can be considered when talking about project maintainability, and one of them, that is fundamental in my opinion, is how we structure the project.

When it comes to managing large scale project which may consist of many modules, or even separate applications, a Nx Workspace based mono-repository is a good candidate for managing such a project. If you don't know what an Nx Workspace is, I encourage you to read my previous article where I introduce it along with monorepo fundamentals.

In this article series, I'll show you:

  • 2 approaches for decomposing a project
  • How they can help you to better manage your project's codebase
  • What tools Nx Workspace provides us with that help us enforce boundaries within a project

Modules vs libraries

It is a well-known good practice, especially when working with a complex Web Application, to divide the functionality into separate, self-contained, and, when possible, reusable modules. This is a great principle and many modern CLIs (ie. Angular, Nest) provide us with tooling for creating such modules with ease, so we don't waste time creating additional module structure by hand.

Of course, we could take it a step further, and instead of just creating a separate module, create a whole separate library instead. This seems to be a bit of an overkill at first, but when we consider that Nx CLI provides us with just as easy a way of creating a library as we did for a module, it doesn't feel so daunting anymore. With that in mind, let's consider what the benefits of creating a separate library instead of just a module are:

  • libs may result in faster builds
    • nx affected command will run the lint, test, build, or any other target only for the libraries that were affected by a given change
    • with buildable libs and incremental builds, we can scale our repo even further
  • libs enable us to enforce stricter boundaries
  • code sharing and minimizing bundle size is easier with libs
    • we can extract and publish reusable parts of our codebase
    • with small and focused libraries we only import small pieces into the application (in the case of multi-app monorepo)

Decomposition strategies - horizontal

In this article, I want to focus on horizontal decomposition strategy, which is great not only for large, enterprise projects, but for smaller applications as well. Horizontal decomposition focuses on splitting the project into layers that are focused on a single technical functionality aspect of the module. A good example of libraries type in this case is:

  • application layer
  • feature layer
  • business logic layer
  • api/data access layer
  • presentational components layer

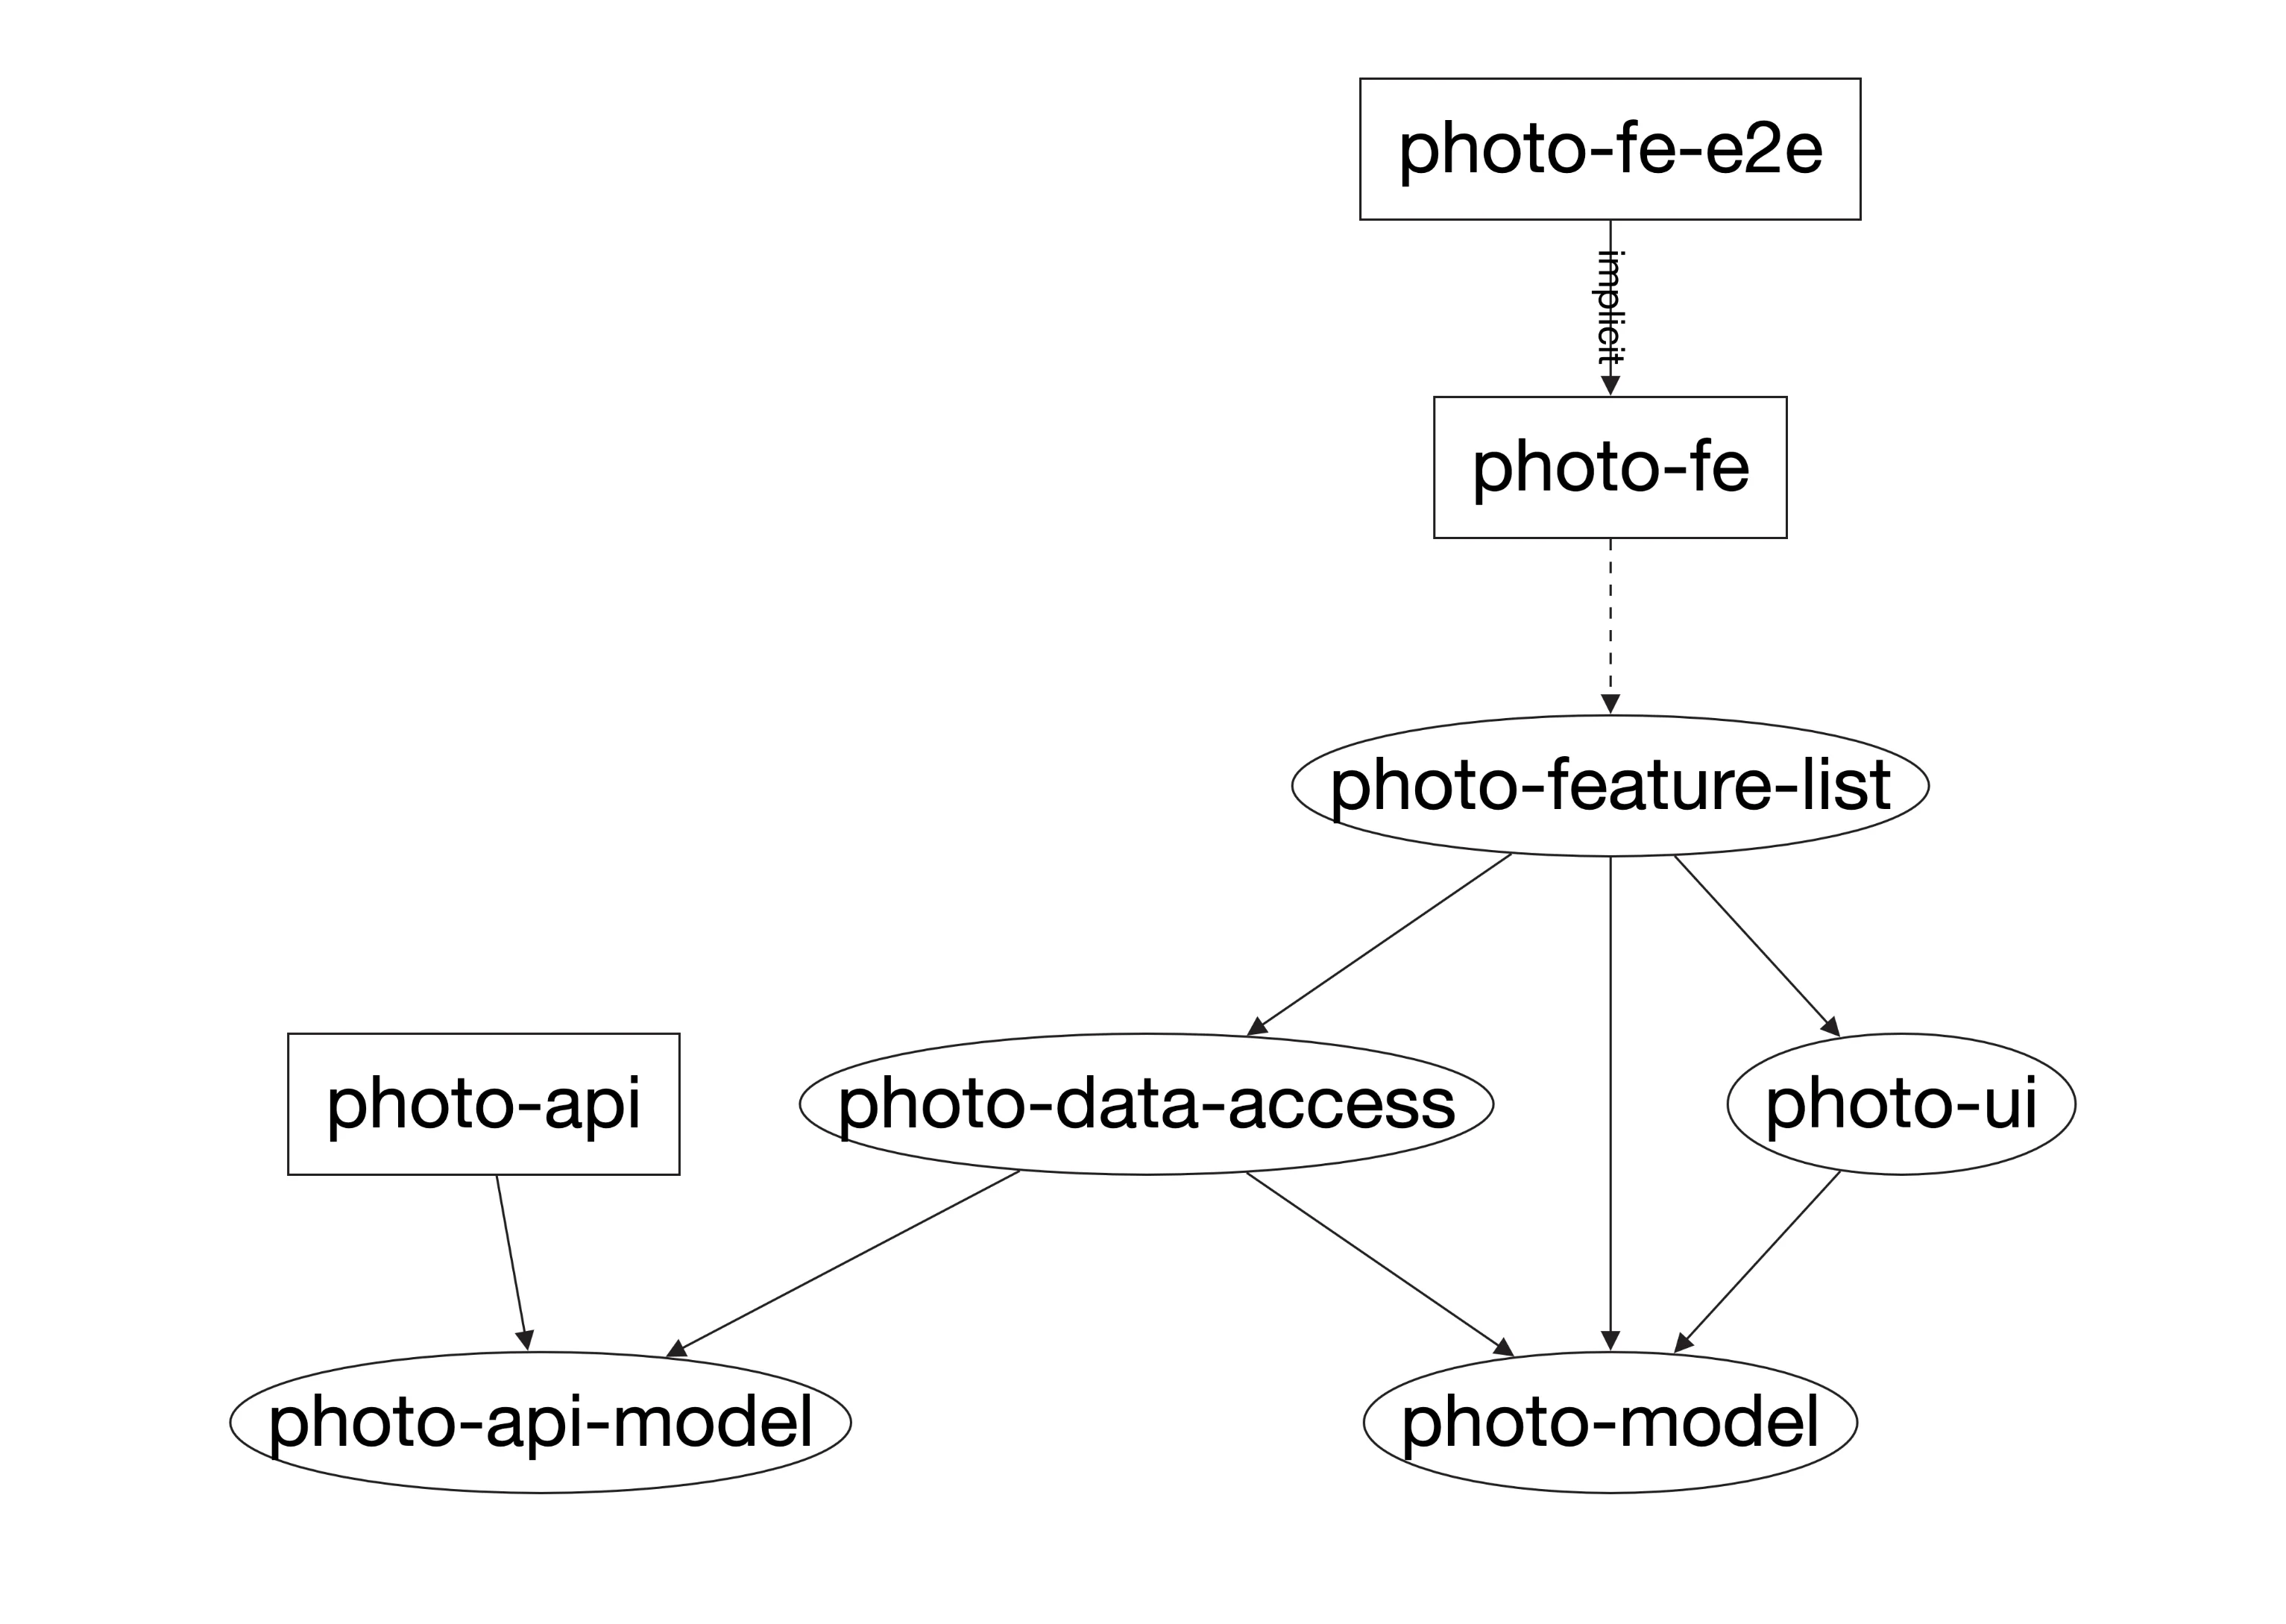
As you may see in this example layering concept, each of the library types has a specific responsibility that can be encapsulated. I have created an example application that demonstrates how the aforementioned decomposition can be applied into even a simple example app. You can find the source code on my repository. Please check out the post/nx-decomposition-p1 branch to get the code related to this post. This application allows a user to see a list of photos and like or dislike them. It is a very simple use case, but even here, we can distinguish few layers of code:

  • photo-fe - frontend application top layer
  • photo-feature-list - this is a feature layer. It collects data from data-access layer, and displays it using ui presentational components.
  • photo-data-access - this is a layer responsible for accessing and storing the data. This is where we include calls to the API and store the received data using NgRx store.
  • photo-ui - this library contains all the presentational components necessary to display the list of photos
  • photo-api-model, photo-model - those are libraries that contain data model structure used either in the API (it's shared by FE and BE applications), and the internal frontend model. API and internal models are the same now but this approach gives us the flexibility to, for example, stop API breaking changes from affecting the whole FE application. To achieve this we could just convert from API to internal model, and vice-versa.

This application decomposition allows for easier modifications of internal layer implementation. As long as we keep the interface intact, we can add additional levels of necessary logic, and not worry about affecting other layers. This way we can split responsibility between team members or whole teams.

Nx workspace comes with a great toolset for managing dependencies between the internal libraries. A great starting point to get a grasp of the repository structure is to visualize the repository structure, and its dependencies. The following command will show us all libraries within a monorepo and dependencies between those libraries:

nx dep-graph

It will open a dependency graph in a browser. From the left side menu, you can choose which projects you want to include in the visualization. After clicking Select all, you should see the following graph:

Nx Dependency Graph - Horizontal layers

You can read more about dependecy graph here:

Enforce boundaries

As you may see in the dependency graph above, our application layer is accessing only certain other parts/libraries. As the project grows, we would probably like to make sure that the code still follows a given structure. I.e. we would not like UI presentational components to access any data access functionality of the application. Their only responsibility should be to display the provided data, and propagate user's interactions via output properties. This is where Nx tags comes in very handy. We can assign each library its own set of predefined tags, and then create boundaries base on those tags. For this example application, let's define the following set of tags:

  • type:application
  • type:feature
  • type:data-access
  • type:ui
  • type:model
  • type:api-model
  • type:be

Now, within the nx.json file, we can assign those tags to specific libraries to reflect its intent:

  "projects": {
    "photo-api-model": {
      "tags": [
        "type:api-model"
      ]
    },
    "photo-data-access": {
      "tags": [
        "type:data-access"
      ]
    },
    "photo-feature-list": {
      "tags": [
        "type:feature"
      ]
    },
    "photo-model": {
      "tags": [
        "type:model"
      ]
    },
    "photo-ui": {
      "tags": [
        "type:ui"
      ]
    },
    "photo-fe": {
      "tags": [
        "type:app"
      ]
    },
    "photo-api": {
      "tags": [
        "type:be"
      ]
    }
  }

Now that we have our tags defined, we can use either an ESLint or TSLint rule provided by Nrwl Nx to restrict access between libraries. Those rules are named @nrwl/nx/enforce-module-boundaries and nx-enforce-module-boundaries for ESLint and TSLint respectively. Let's define our allowed libraries anteriactions as follows:

  • type:application - can only access type:feature libraries
  • type:feature - can only access type:data-access, type:model, type:ui libraries
  • type:data-access - can only access type:api-model, type:model libraries
  • type:ui - can only access type:ui, type:model libraries
  • type:model - can not access other libraries
  • type:api-model - can not access other libraries
  • type:be - can only access type:api-model libraries

To enforce those constraints we can add each of the rules mentioned above to the @nrwl/nx/enforce-module-boundaries, or nx-enforce-module-boundaries configuration. Let's open the top level .eslintrc.json or .tslint.json files, and replace the default configuration with the following one:

"@nrwl/nx/enforce-module-boundaries": [
  "error",
  {
    "enforceBuildableLibDependency": true,
    "allow": [],
    "depConstraints": [
      {
        "sourceTag": "type:app",
        "onlyDependOnLibsWithTags": ["type:feature"]
      },
      {
        "sourceTag": "type:feature",
        "onlyDependOnLibsWithTags": ["type:data-access","type:model", "type:ui"]
      },
      {
        "sourceTag": "type:data-access",
        "onlyDependOnLibsWithTags": ["type:api-model", "type:model"]
      },
      {
        "sourceTag": "type:ui",
        "onlyDependOnLibsWithTags": ["type:ui", "type:model"]
      },
      {
        "sourceTag": "type:be",
        "onlyDependOnLibsWithTags": ["type:api-model"]
      }

    ]
  }
]

For type:model and type:api-model, we can either not include any configuration, or explicitly add configuration with an empty array of allowed tags:

{
  "sourceTag": "type:model",
  "onlyDependOnLibsWithTags": []
},
{
  "sourceTag": "type:api-model",
  "onlyDependOnLibsWithTags": []
}

Now, you can run the following command to verify that all constraints are met:

nx run-many --target=lint --all

You can set up the CI to run this check for all the PRs to the repository, and therefore, avoid including code that does not follow the architectural pattern that you decided for your project.

If any of the aforementioned constrains were violated, the linting process would produce an error like this

A project tagged with "type:data-access" can only depend on projects tagged with "type:api-model" or "type:model".

This gives a clear message on what the problem is, and tells the developer that they are trying to do something that should not be done.

You can read more about Nx tags & constraints in the documentation.

Conclusion

When designing a software solution that is expected to grow and be maintained for a long time, it is crucial to create an architecture that will support that goal. Composing an application out of well-defined and separated horizontal layers is a great tool that can be applied to a variety of projects - even the smaller ones. Nx comes with a built-in generic mechanism that allows system architects to impose their architectural decisions on a project and prevent unrestrained access between libraries. Additionally, with a help of Nx CLI, it is just as fast and easy to create new libraries as with creating a new module. So why not take advantage of it?

In case you have any questions, you can always tweet or DM me @ktrz. I'm always happy to help!

This Dot is a consultancy dedicated to guiding companies through their modernization and digital transformation journeys. Specializing in replatforming, modernizing, and launching new initiatives, we stand out by taking true ownership of your engineering projects.

We love helping teams with projects that have missed their deadlines or helping keep your strategic digital initiatives on course. Check out our case studies and our clients that trust us with their engineering.

You might also like

The Importance of a Scientific Mindset in Software Engineering: Part 2 (Debugging) cover image

The Importance of a Scientific Mindset in Software Engineering: Part 2 (Debugging)

The Importance of a Scientific Mindset in Software Engineering: Part 2 (Debugging) In the first part of my series on the importance of a scientific mindset in software engineering, we explored how the principles of the scientific method can help us evaluate sources and make informed decisions. Now, we will focus on how these principles can help us tackle one of the most crucial and challenging tasks in software engineering: debugging. In software engineering, debugging is often viewed as an art - an intuitive skill honed through experience and trial and error. In a way, it is - the same as a GP, even a very evidence-based one, will likely diagnose most of their patients based on their experience and intuition and not research scientific literature every time; a software engineer will often rely on their experience and intuition to identify and fix common bugs. However, an internist faced with a complex case will likely not be able to rely on their intuition alone and must apply the scientific method to diagnose the patient. Similarly, a software engineer can benefit from using the scientific method to identify and fix the problem when faced with a complex bug. From that perspective, treating engineering challenges like scientific inquiries can transform the way we tackle problems. Rather than resorting to guesswork or gut feelings, we can apply the principles of the scientific method—forming hypotheses, designing controlled experiments, gathering and evaluating evidence—to identify and eliminate bugs systematically. This approach, sometimes referred to as "scientific debugging," reframes debugging from a haphazard process into a structured, disciplined practice. It encourages us to be skeptical, methodical, and transparent in our reasoning. For instance, as Andreas Zeller notes in the book _Why Programs Fail_, the key aspect of scientific debugging is its explicitness: Using the scientific method, you make your assumptions and reasoning explicit, allowing you to understand your assumptions and often reveals hidden clues that can lead to the root cause of the problem on hand. Note: If you'd like to read an excerpt from the book, you can find it on Embedded.com. Scientific Debugging At its core, scientific debugging applies the principles of the scientific method to the process of finding and fixing software defects. Rather than attempting random fixes or relying on intuition, it encourages engineers to move systematically, guided by data, hypotheses, and controlled experimentation. By adopting debugging as a rigorous inquiry, we can reduce guesswork, speed up the resolution process, and ensure that our fixes are based on solid evidence. Just as a scientist begins with a well-defined research question, a software engineer starts by identifying the specific symptom or error condition. For instance, if our users report inconsistencies in the data they see across different parts of the application, our research question could be: _"Under what conditions does the application display outdated or incorrect user data?"_ From there, we can follow a structured debugging process that mirrors the scientific method: - 1. Observe and Define the Problem: First, we need to clearly state the bug's symptoms and the environment in which it occurs. We should isolate whether the issue is deterministic or intermittent and identify any known triggers if possible. Such a structured definition serves as the groundwork for further investigation. - 2. Formulate a Hypothesis: A hypothesis in debugging is a testable explanation for the observed behavior. For instance, you might hypothesize: _"The data inconsistency occurs because a caching layer is serving stale data when certain user profiles are updated."_ The key is that this explanation must be falsifiable; if experiments don't support the hypothesis, it must be refined or discarded. - 3. Collect Evidence and Data: Evidence often includes logs, system metrics, error messages, and runtime traces. Similar to reviewing primary sources in academic research, treat your raw debugging data as crucial evidence. Evaluating these data points can reveal patterns. In our example, such patterns could be whether the bug correlates with specific caching mechanisms, increased memory usage, or database query latency. During this step, it's essential to approach data critically, just as you would analyze the quality and credibility of sources in a research literature review. Don't forget that even logs can be misleading, incomplete, or even incorrect, so cross-referencing multiple sources is key. - 4. Design and Run Experiments: Design minimal, controlled tests to confirm or refute your hypothesis. In our example, you may try disabling or shortening the cache's time-to-live (TTL) to see if more recent data is displayed correctly. By manipulating one variable at a time - such as cache invalidation intervals - you gain clearer insights into causation. Tools such as profilers, debuggers, or specialized test harnesses can help isolate factors and gather precise measurements. - 5. Analyze Results and Refine Hypotheses: If the experiment's outcome doesn't align with your hypothesis, treat it as a stepping stone, not a dead end. Adjust your explanation, form a new hypothesis, or consider additional variables (for example, whether certain API calls bypass caching). Each iteration should bring you closer to a better understanding of the bug's root cause. Remember, the goal is not to prove an initial guess right but to arrive at a verifiable explanation. - 6. Implement and Verify the Fix: Once you're confident in the identified cause, you can implement the fix. Verification doesn't stop at deployment - re-test under the same conditions and, if possible, beyond them. By confirming the fix in a controlled manner, you ensure that the solution is backed by evidence rather than wishful thinking. - Personally, I consider implementing end-to-end tests (e.g., with Playwright) that reproduce the bug and verify the fix to be a crucial part of this step. This both ensures that the bug doesn't reappear in the future due to changes in the codebase and avoids possible imprecisions of manual testing. Now, we can explore these steps in more detail, highlighting how the scientific method can guide us through the debugging process. Establishing Clear Debugging Questions (Formulating a Hypothesis) A hypothesis is a proposed explanation for a phenomenon that can be tested through experimentation. In a debugging context, that phenomenon is the bug or issue you're trying to resolve. Having a clear, falsifiable statement that you can prove or disprove ensures that you stay focused on the real problem rather than jumping haphazardly between possible causes. A properly formulated hypothesis lets you design precise experiments to evaluate whether your explanation holds true. To formulate a hypothesis effectively, you can follow these steps: 1. Clearly Identify the Symptom(s) Before forming any hypothesis, pin down the specific issue users are experiencing. For instance: - "Users intermittently see outdated profile information after updating their accounts." - "Some newly created user profiles don't reflect changes in certain parts of the application." Having a well-defined problem statement keeps your hypothesis focused on the actual issue. Just like a research question in science, the clarity of your symptom definition directly influences the quality of your hypothesis. 2. Draft a Tentative Explanation Next, convert your symptom into a statement that describes a _possible root cause_, such as: - "Data inconsistency occurs because the caching layer isn't invalidating or refreshing user data properly when profiles are updated." - "Stale data is displayed because the cache timeout is too long under certain load conditions." This step makes your assumption about the root cause explicit. As with the scientific method, your hypothesis should be something you can test and either confirm or refute with data or experimentation. 3. Ensure Falsifiability A valid hypothesis must be falsifiable - meaning it can be proven _wrong_. You'll struggle to design meaningful experiments if a hypothesis is too vague or broad. For example: - Not Falsifiable: "Occasionally, the application just shows weird data." - Falsifiable: "Users see stale data when the cache is not invalidated within 30 seconds of profile updates." Making your hypothesis specific enough to fail a test will pave the way for more precise debugging. 4. Align with Available Evidence Match your hypothesis to what you already know - logs, stack traces, metrics, and user reports. For example: - If logs reveal that cache invalidation events aren't firing, form a hypothesis explaining why those events fail or never occur. - If metrics show that data served from the cache is older than the configured TTL, hypothesize about how or why the TTL is being ignored. If your current explanation contradicts existing data, refine your hypothesis until it fits. 5. Plan for Controlled Tests Once you have a testable hypothesis, figure out how you'll attempt to _disprove_ it. This might involve: - Reproducing the environment: Set up a staging/local system that closely mimics production. For instance with the same cache layer configurations. - Varying one condition at a time: For example, only adjust cache invalidation policies or TTLs and then observe how data freshness changes. - Monitoring metrics: In our example, such monitoring would involve tracking user profile updates, cache hits/misses, and response times. These metrics should lead to confirming or rejecting your explanation. These plans become your blueprint for experiments in further debugging stages. Collecting and Evaluating Evidence After formulating a clear, testable hypothesis, the next crucial step is to gather data that can either support or refute it. This mirrors how scientists collect observations in a literature review or initial experiments. 1. Identify "Primary Sources" (Logs, Stack Traces, Code History): - Logs and Stack Traces: These are your direct pieces of evidence - treat them like raw experimental data. For instance, look closely at timestamps, caching-related events (e.g., invalidation triggers), and any error messages related to stale reads. - Code History: Look for related changes in your source control, e.g. using Git bisect. In our example, we would look for changes to caching mechanisms or references to cache libraries in commits, which could pinpoint when the inconsistency was introduced. Sometimes, reverting a commit that altered cache settings helps confirm whether the bug originated there. 2. Corroborate with "Secondary Sources" (Documentation, Q&A Forums): - Documentation: Check official docs for known behavior or configuration details that might differ from your assumptions. - Community Knowledge: Similar issues reported on GitHub or StackOverflow may reveal known pitfalls in a library you're using. 3. Assess Data Quality and Relevance: - Look for Patterns: For instance, does stale data appear only after certain update frequencies or at specific times of day? - Check Environmental Factors: For instance, does the bug happen only with particular deployment setups, container configurations, or memory constraints? - Watch Out for Biases: Avoid seeking only the data that confirms your hypothesis. Look for contradictory logs or metrics that might point to other root causes. You keep your hypothesis grounded in real-world system behavior by treating logs, stack traces, and code history as primary data - akin to raw experimental results. This evidence-first approach reduces guesswork and guides more precise experiments. Designing and Running Experiments With a hypothesis in hand and evidence gathered, it's time to test it through controlled experiments - much like scientists isolate variables to verify or debunk an explanation. 1. Set Up a Reproducible Environment: - Testing Environments: Replicate production conditions as closely as possible. In our example, that would involve ensuring the same caching configuration, library versions, and relevant data sets are in place. - Version Control Branches: Use a dedicated branch to experiment with different settings or configuration, e.g., cache invalidation strategies. This streamlines reverting changes if needed. 2. Control Variables One at a Time: - For instance, if you suspect data inconsistency is tied to cache invalidation events, first adjust only the invalidation timeout and re-test. - Or, if concurrency could be a factor (e.g., multiple requests updating user data simultaneously), test different concurrency levels to see if stale data issues become more pronounced. 3. Measure and Record Outcomes: - Automated Tests: Tests provide a great way to formalize and verify your assumptions. For instance, you could develop tests that intentionally update user profiles and check if the displayed data matches the latest state. - Monitoring Tools: Monitor relevant metrics before, during, and after each experiment. In our example, we might want to track cache hit rates, TTL durations, and query times. - Repeat Trials: Consistency across multiple runs boosts confidence in your findings. 4. Validate Against a Baseline: - If baseline tests manifest normal behavior, but your experimental changes manifest the bug, you've isolated the variable causing the issue. E.g. if the baseline tests show that data is consistently fresh under normal caching conditions but your experimental changes cause stale data. - Conversely, if your change eliminates the buggy behavior, it supports your hypothesis - e.g. that the cache configuration was the root cause. Each experiment outcome is a data point supporting or contradicting your hypothesis. Over time, these data points guide you toward the true cause. Analyzing Results and Iterating In scientific debugging, an unexpected result isn't a failure - it's valuable feedback that brings you closer to the right explanation. 1. Compare Outcomes to the hypothesis. For instance: - Did user data stay consistent after you reduced the cache TTL or fixed invalidation logic? - Did logs show caching events firing as expected, or did they reveal unexpected errors? - Are there only partial improvements that suggest multiple overlapping issues? 2. Incorporate Unexpected Observations: - Sometimes, debugging uncovers side effects - e.g. performance bottlenecks exposed by more frequent cache invalidations. Note these for future work. - If your hypothesis is disproven, revise it. For example, the cache may only be part of the problem, and a separate load balancer setting also needs attention. 3. Avoid Confirmation Bias: - Don't dismiss contrary data. For instance, if you see evidence that updates are fresh in some modules but stale in others, you may have found a more nuanced root cause (e.g., partial cache invalidation). - Consider other credible explanations if your teammates propose them. Test those with the same rigor. 4. Decide If You Need More Data: - If results aren't conclusive, add deeper instrumentation or enable debug modes to capture more detailed logs. - For production-only issues, implement distributed tracing or sampling logs to diagnose real-world usage patterns. 5. Document Each Iteration: - Record the results of each experiment, including any unexpected findings or new hypotheses that arise. - Through iterative experimentation and analysis, each cycle refines your understanding. By letting evidence shape your hypothesis, you ensure that your final conclusion aligns with reality. Implementing and Verifying the Fix Once you've identified the likely culprit - say, a misconfigured or missing cache invalidation policy - the next step is to implement a fix and verify its resilience. 1. Implementing the Change: - Scoped Changes: Adjust just the component pinpointed in your experiments. Avoid large-scale refactoring that might introduce other issues. - Code Reviews: Peer reviews can catch overlooked logic gaps or confirm that your changes align with best practices. 2. Regression Testing: - Re-run the same experiments that initially exposed the issue. In our stale data example, confirm that the data remains fresh under various conditions. - Conduct broader tests - like integration or end-to-end tests - to ensure no new bugs are introduced. 3. Monitoring in Production: - Even with positive test results, real-world scenarios can differ. Monitor logs and metrics (e.g. cache hit rates, user error reports) closely post-deployment. - If the buggy behavior reappears, revisit your hypothesis or consider additional factors, such as unpredicted user behavior. 4. Benchmarking and Performance Checks (If Relevant): - When making changes that affect the frequency of certain processes - such as how often a cache is refreshed - be sure to measure the performance impact. Verify you meet any latency or resource usage requirements. - Keep an eye on the trade-offs: For instance, more frequent cache invalidations might solve stale data but could also raise system load. By systematically verifying your fix - similar to confirming experimental results in research - you ensure that you've addressed the true cause and maintained overall software stability. Documenting the Debugging Process Good science relies on transparency, and so does effective debugging. Thorough documentation guarantees your findings are reproducible and valuable to future team members. 1. Record Your Hypothesis and Experiments: - Keep a concise log of your main hypothesis, the tests you performed, and the outcomes. - A simple markdown file within the repo can capture critical insights without being cumbersome. 2. Highlight Key Evidence and Observations: - Note the logs or metrics that were most instrumental - e.g., seeing repeated stale cache hits 10 minutes after updates. - Document any edge cases discovered along the way. 3. List Follow-Up Actions or Potential Risks: - If you discover additional issues - like memory spikes from more frequent invalidation - note them for future sprints. - Identify parts of the code that might need deeper testing or refactoring to prevent similar issues. 4. Share with Your Team: - Publish your debugging report on an internal wiki or ticket system. A well-documented troubleshooting narrative helps educate other developers. - Encouraging open discussion of the debugging process fosters a culture of continuous learning and collaboration. By paralleling scientific publication practices in your documentation, you establish a knowledge base to guide future debugging efforts and accelerate collective problem-solving. Conclusion Debugging can be as much a rigorous, methodical exercise as an art shaped by intuition and experience. By adopting the principles of scientific inquiry - forming hypotheses, designing controlled experiments, gathering evidence, and transparently documenting your process - you make your debugging approach both systematic and repeatable. The explicitness and structure of scientific debugging offer several benefits: - Better Root-Cause Discovery: Structured, hypothesis-driven debugging sheds light on the _true_ underlying factors causing defects rather than simply masking symptoms. - Informed Decisions: Data and evidence lead the way, minimizing guesswork and reducing the chance of reintroducing similar issues. - Knowledge Sharing: As in scientific research, detailed documentation of methods and outcomes helps others learn from your process and fosters a collaborative culture. Ultimately, whether you are diagnosing an intermittent crash or chasing elusive performance bottlenecks, scientific debugging brings clarity and objectivity to your workflow. By aligning your debugging practices with the scientific method, you build confidence in your solutions and empower your team to tackle complex software challenges with precision and reliability. But most importantly, do not get discouraged by the number of rigorous steps outlined above or by the fact you won't always manage to follow them all religiously. Debugging is a complex and often frustrating process, and it's okay to rely on your intuition and experience when needed. Feel free to adapt the debugging process to your needs and constraints, and as long as you keep the scientific mindset at heart, you'll be on the right track....

Quo v[AI]dis, Tech Stack? cover image

Quo v[AI]dis, Tech Stack?

Since we've started extensively leveraging AI at This Dot to enhance development workflows and experimenting with different ways to make it as helpful as possible, there's been a creeping thought on my mind - Is AI just helping us write code faster, or is it silently reshaping what code we choose to write? Eventually, this thought led to an interesting conversation on our company's Slack about the impact of AI on our tech stack choices. Some of the views shared there included: - "The battle between static and dynamic types is over. TypeScript won." - "The fast-paced development of new frameworks and the excitement around new shiny technologies is slowing down. AI can make existing things work with a workaround in a few minutes, so why create or adopt something new?" - "AI models are more trained on the most popular stacks, so they will naturally favor those, leading to a self-reinforcing loop." - "A lot of AI coding assistants serve as marketing funnels for specific stacks, such as v0 being tailored to Next.js and Vercel or Lovable using Supabase and Clerk." All of these points are valid and interesting, but they also made me think about the bigger picture. So I decided to do some extensive research (read "I decided to make the OpenAI Deep Research tool do it for me") and summarize my findings in this article. So without further ado, here are some structured thoughts on how AI is reshaping our tech stack choices, and what it means for the future of software development. 1. LLMs as the New Developer Platform If software development is a journey, LLMs have become the new high-speed train line. Long gone are the days when we used Copilot as a fancy autocomplete tool. Don't get me wrong, it was mind-bogglingly good when it first came out, and I've used it extensively. But now, a few years later, LLMs have evolved into something much more powerful. With the rise of tools like Cursor, Windsurf, Roo Code, or Claude Code, LLMs are essentially becoming the new developer platform. They are no longer just a helper that autocompletes a switch statement or a function signature, but a full-fledged platform that can generate entire applications, write tests, and even refactor code. And it is not just a few evangelists or early adopters who are using these tools. They have become mainstream, with millions of developers relying on them daily. According to Deloitte, nearly 20% of devs in tech firms were already using generative AI coding tools by 2024, with 76% of StackOverflow respondents using or planning to use AI tools in their development process, according to the 2024 StackOverflow Developer Survey. They've become an integral part of the development workflow, mediating how code is written, reviewed, and learned. I've argued in the past that LLMs are becoming a new layer of abstraction in software development, but now I believe they are evolving into something even more powerful - a new developer platform that is shaping how we think about and approach software development. 2. The Reinforcement Loop: Popular Stacks Get Smarter As we travel this AI-guided road, we find that certain routes become highways, while others lead to narrow paths or even dead ends. AI tools are not just helping us write code faster; they are also shaping our preferences for certain tech stacks. The most popular frameworks and languages, such as React.js on the frontend and Node.js on the backend (both with 40% adoption), are the ones that AI tools perform best with. Their increasing popularity is not just a coincidence; it's a result of a self-reinforcing loop. AI models are trained on vast amounts of code, and the most popular stacks naturally have more data available for training, given their widespread use, leading to more questions, answers, and examples in the training data. This means that AI tools are inherently better at understanding and generating code for these stacks. As an anecdotal example, I've noticed that AI tools tend to suggest React.js even when I specify a preference for another framework. As someone working with multiple tech stacks, I can attest that AI tools are significantly more effective with React.js or Node.js than, say, Yii2 or CakePHP. This phenomenon is not limited to just one or two stacks; it applies to the entire ecosystem. The more a stack is used, the more data there is for AI to learn from, and the better it gets at generating code for that stack, resulting in a feedback loop: 1. AI performs better on popular stacks. 2. Popular stacks get more adoption as developers find them easier to work with. 3. More developers using those stacks means more data for AI to learn from. 4. The cycle continues, reinforcing the popularity of those stacks. The issue is maybe even more evident with CSS frameworks. TailwindCSS, for example, has gained immense popularity thanks to its utility-first approach, which aligns well with AI's ability to generate and manipulate styles. As more developers adopt TailwindCSS, AI tools become better at understanding its conventions and generating appropriate styles, further driving its adoption. However, the Tailwind CSS example also highlights a potential pitfall of this reinforcement loop. Tailwind CSS v4 was released in January 2025. From my experience, AI tools still attempt to generate code using v3 concepts and often need to be reminded to use Tailwind CSS v4, requiring spoon-feeding with documentation to get it right. Effectively, this phenomenon can lead to a situation where AI tools not only reinforce the popularity of certain stacks but also potentially slow down the adoption of newer versions or alternatives. 3. Frontend Acceleration: React, Angular, and Beyond Navigating the frontend landscape has always been tricky, but with AI, some paths feel like smooth expressways while others remain bumpy dirt roads. AI is particularly transformative in frontend development, where the complexity and boilerplate code can be overwhelming. Established frameworks like React and Angular, which are already popular, are seeing even more adoption due to AI's ability to generate components, tests, and optimizations. React's widespread adoption and its status as the most popular framework on the frontend make it the go-to choice for many developers, especially with AI tools that can quickly scaffold new components or entire applications. However, Angular's strict structure and type safety also make it a strong contender. Angular's opinionated nature can actually benefit AI-generated code, as it provides a clear framework for the AI to follow, reducing ambiguity and potential bugs. > Call me crazy but I think that long term Angular is going to work better with AI tools for frontend work. > > More strict rules to follow, easier to build and scale. Just like for humans. > > We just need to keep Angular opinionated enough. > > — Daniel Glejzner on X But it's not just about how the frameworks are structured; it's also the documentation they provide. It has recently become the norm for frameworks to have AI-friendly documentation. Angular, for instance, has a llms.txt file that you can reference in your AI prompts to get more relevant results. The best example, however, in my opinion, is the Nuxt.ui documentation, which provides the option to copy each documentation page as markdown or a link to its markdown version, making it easy to reference in AI prompts. Frameworks that incorporate AI-friendly documentation and tooling are likely to experience increased adoption, as they facilitate developers' ability to leverage AI's capabilities. 4. Full-Stack TS/JS: The Sweet Spot On this AI-accelerated journey, some stacks have emerged as the smoothest rides, and full-stack JavaScript/TypeScript is leading the way. The combination of React on the frontend and Node.js on the backend provides a unified language ecosystem, making the road less bumpy for developers. Shared types, common tooling, and mature libraries enable faster prototyping and reduced context switching. AI seems to enjoy these well-paved highways too. I've observed numerous instances where AI tools default to suggesting Next.js and Tailwind CSS for new projects, even when users are prompted otherwise. While you can force a slight detour to something like Nuxt or SvelteKit, the road suddenly gets patchier - AI becomes less confident, requires more hand-holding, and sometimes outright stalls. So while still technically being in the sweet spot of full-stack JavaScript/TypeScript, deviating from the "main highway" even slightly can lead to a much rougher ride. React-based full-stack frameworks are becoming mainstream, not necessarily because they are always the best solution, but because they are the path of least resistance for both humans and AI. 5. The Polyglot Shift: AI Enables Multilingual Devs One fascinating development on this journey is how AI is enabling more developers to become polyglots. Where switching stacks used to feel like taking detours into unknown territory, AI now acts like an on-demand guide. Whether it’s switching from Laravel to Spring Boot or from Angular to Svelte, AI helps bridge those knowledge gaps quickly. At This Dot, we've always taken pride in our polyglot approach, but AI is lowering the barriers for everyone. Yes, we've done this before the rise of AI tooling. If you are an experienced engineer with a strong understanding of programming concepts, you'll be able to adapt to different stacks and projects quickly. But AI is now enabling even junior developers to become polyglots, and it's making it even easier for the experienced ones to switch between stacks seamlessly. AI doesn’t just shorten the journey - it makes more destinations accessible. This "AI boost" not only facilitates the job of a software consultant, such as myself, who often has to switch between different projects, but it also opens the door to unlimited possibilities for companies to mix and match stacks based on their needs - particularly useful for companies that have diverse tech stacks, as it allows them to leverage the strengths of different languages and frameworks without the steep learning curve that usually comes with it. 6. AI-Generated Stack Bundles: The Trojan Horse > Trend I'm seeing: AI app generators are a sales funnel. > > -Chef uses Convex. > > -V0 is optimized for Vercel. > > -Lovable uses Supabase and Clerk. > > -Firebase Studio uses Google services. > > These tools act like a trojan horse - they "sell" a tech stack. > > Choose wisely. > > — Cory House on X Some roads come pre-built, but with toll booths you may not notice until you're halfway through the trip. AI-generated apps from tools like v0, Firebase Studio, or Lovable are convenience highways - fast, smooth, and easy to follow - but they quietly nudge you toward specific tech stacks, backend services, databases, and deployment platforms. It's a smart business model. These tools don't just scaffold your app; they bundle in opinions on hosting, auth providers, and DB layers. The convenience is undeniable, but there's a trade-off in flexibility and long-term maintainability. Engineering leaders must stay alert, like seasoned navigators, ensuring that the allure of speed doesn't lead their teams down the alleyways of vendor lock-in. 7. From 'Buy vs Build' to 'Prompt vs Buy' The classic dilemma used to be _“buy vs build”_ - now it’s becoming “prompt vs buy.” Why pay for a bloated tour bus of a SaaS product, packed with destinations and detours you’ll never take (and priced accordingly), when you can chart a custom route with a few well-crafted prompts and have a lightweight internal tool up and running in days—or even hours? Do you need a simple tool to track customer contacts with a few custom fields and a clean interface? In the past, you might have booked a seat on the nearest SaaS solution - one that gets you close enough to your destination but comes with unnecessary stops and baggage. With AI, you can now skip the crowded bus altogether and build a tailor-made vehicle that drives exactly where you need to go, no more, no less. AI reshapes the travel map of product development. The road to MVPs has become faster, cheaper, and more direct. This shift is already rerouting the internal tooling landscape, steering companies away from bulky, one-size-fits-all platforms toward lean, AI-assembled solutions. And over time, it may change not just _how_ we build, but _where_ we build - with the smoothest highways forming around AI-friendly, modular ecosystems like Node, React, and TypeScript, while older “corporate” expressways like .NET, Java, or even Angular risk becoming the slow scenic routes of enterprise tech. 8. Strategic Implications: Velocity vs Maintainability Every shortcut comes with trade-offs. The fast lane that AI offers boosts productivity but can sometimes encourage shortcuts in architecture and design. Speeding to your destination is great - until you hit the maintenance toll booth further down the road. AI tooling makes it easier to throw together an MVP, but without experienced oversight, the resulting codebases can turn into spaghetti highways. Teams need to implement AI-era best practices: structured code reviews, prompt hygiene, and deliberate stack choices that prioritize long-term maintainability over short-term convenience. Failing to do so can lead to a "quick and dirty" mentality, where the focus is on getting things done fast rather than building robust, maintainable solutions, which is particularly concerning for companies that rely on in-house developers or junior teams who may not have the experience to recognize potential pitfalls in AI-generated code. 9. Closing Reflection: Are We Still Choosing Our Stacks? So, where are we heading? Looking at the current "traffic" on the modern software development pathways, one thing becomes clear: AI isn't just a productivity tool - the roads themselves are starting to shape the journey. What was once a deliberate process of choosing the right vehicle for the right terrain - picking our stacks based on product goals, team expertise, and long-term maintainability - now feels more like following GPS directions that constantly recalculate to the path of least resistance. AI is repaving the main routes, widening the lanes for certain tech stacks, and putting up "scenic route" signs for some frameworks while leaving others on neglected backroads. This doesn't mean we've lost control of the steering wheel, but it does mean that the map is changing beneath us in ways that are easy to overlook. The risk is clear: we may find ourselves taking the smoothest on-ramps without ever asking if they lead to where we actually want to go. Convenience can quietly take priority over appropriateness. Productivity gains in the short term can pave over technical debt potholes that become unavoidable down the road. But the story isn't entirely one of caution. There's a powerful opportunity here too. With AI as a co-pilot, we can explore more destinations than ever before - venturing into unfamiliar tech stacks, accelerating MVP development, or rapidly prototyping ideas that previously seemed out of reach. The key is to remain intentional about when to cruise with AI autopilot and when to take the wheel with both hands and steer purposefully. In this new era of AI-shaped development, the question every engineering team should be asking is not just "how fast can we go?" but "are we on the right road?" and "who's really choosing our route?" And let’s not forget — some of these roads are still being built. Open-source maintainers and framework authors play a pivotal role in shaping which paths become highways. By designing AI-friendly architectures, providing structured, machine-readable documentation, and baking in patterns that are easy for AI models to learn and suggest, they can guide where AI directs traffic. Frameworks that proactively optimize for AI tooling aren’t just improving developer experience — they’re shaping the very flow of adoption in this AI-accelerated landscape. If we're not mindful, we risk becoming passengers on a journey defined by default choices. However, if we remain vigilant, we can utilize AI to create more accurate maps, not just follow the fastest roads, but also chart new ones. Because while the routes may be getting redrawn, the destination should always be ours to choose. In the end, the real competitive advantage will belong to those who can harness AI's speed while keeping their hands firmly on the wheel - navigating not by ease, but by purpose. In this new era, the most valuable skill may not be prompt engineering - it might be strategic discernment....

How to Create a Bot That Sends Slack Messages Using Block Kit and GitHub Actions cover image

How to Create a Bot That Sends Slack Messages Using Block Kit and GitHub Actions

Have you ever wanted to get custom notifications in Slack about new interactions in your GitHub repository? If so, then you're in luck. With the help of GitHub actions and Slack's Block Kit, it is super easy to set up automated workflows that will send custom messages to your Slack channel of choice. In this article, I will guide you on how to set up the Slack bot and send automatic messages using GH actions. Create a Slack app Firstly, we need to create a new Slack application. Go to Slack's app page. If you haven't created an app before you should see: otherwise you might see a list of your existing apps: Let's click the Create an App button. Frpm a modal that shows up, choose From scratch option: In the next step, we can choose the app's name (eg. My Awesome Slack App) and pick a workspace that you want to use for testing the app. After the app is created successfully, we need to configure a couple of additional options. Firstly we need to configure the OAuth & Permissions section: In the Scopes section, we need to add a proper scope for our bot. Let's click Add an OAuth Scope in the Bot Token Scopes section, and select an incoming-webhook scope: Next, in OAuth Tokens for Your Workspace section, click Install to Workspace and choose a channel that you want messages to be posted to. Finally, let's go to Incoming Webhooks page, and activate the incoming hooks toggle (if it wasn't already activated). Copy the webhook URL (we will need it for our GitHub action). Create a Github Action Workflow In this section, we will focus on setting up the GitHub action workflow that will post messages on behalf of the app we've just created. You can use any of your existing repositories, or create a new one. Setting Up Secrets In your repository, go to Settings -> Secrets and variables -> Actions section and create a New Repository Secret. We will call the secret SLACK_WEBHOOK_URL and paste the url we've previously copied as a value. Create a workflow To actually send a message we can use slackapi/slack-github-action GitHub action. To get started, we need to create a workflow file in .github/workflows directory. Let's create .github/workflows/slack-message.yml file to your repository with the following content and commit the changes to main branch. ` In this workflow, we've created a job that uses slackapi/slack-github-action action and sends a basic message with an action run id. The important thing is that we need to set our webhook url as an env variable. This was the action can use it to send a message to the correct endpoint. We've configured the action so that it can be triggered manually. Let's trigger it by going to Actions -> Send Slack notification We can run the workflow manually in the top right corner. After running the workflow, we should see our first message in the Slack channel that we've configured earlier. Manually triggering the workflow to send a message is not very useful. However, we now have the basics to create more useful actions. Automatic message on pull request merge Let's create an action that will send a notification to Slack about a new contribution to our repository. We will use Slack's Block Kit to construct our message. Firstly, we need to modify our workflow so that instead of being manually triggered, it runs automatically when a pull requests to main branch is merged. This can be configured in the on section of the workflow file: ` Secondly, let's make sure that we only run the workflow when a pull request is merged and not eg. closed without merging. We can configure that by using if condition on the job: ` We've used a repository name (github.repository) as well as the user login that created a pull request (github.event.pull_request.user.login), but we could customize the message with as many information as we can find in the pull_request event. If you want to quickly edit and preview the message template, you can use the Slack's Block Kit Builder. Now we can create any PR, eg. add some changes to README.md, and after the PR is merged, we will get a Slack message like this. Summary As I have shown in this article, sending Slack messages automatically using GitHub actions is quite easy. If you want to check the real life example, visit the starter.dev project where we are using the slackapi/slack-github-action to get notifications about new contributions (send-slack-notification.yml) If you have any questions, you can always Tweet or DM me at @ktrz. I'm always happy to help!...

Understanding Sourcemaps: From Development to Production cover image

Understanding Sourcemaps: From Development to Production

What Are Sourcemaps? Modern web development involves transforming your source code before deploying it. We minify JavaScript to reduce file sizes, bundle multiple files together, transpile TypeScript to JavaScript, and convert modern syntax into browser-compatible code. These optimizations are essential for performance, but they create a significant problem: the code running in production does not look like the original code you wrote. Here's a simple example. Your original code might look like this: ` After minification, it becomes something like this: ` Now imagine trying to debug an error in that minified code. Which line threw the exception? What was the value of variable d? This is where sourcemaps come in. A sourcemap is a JSON file that contains a mapping between your transformed code and your original source files. When you open browser DevTools, the browser reads these mappings and reconstructs your original code, allowing you to debug with variable names, comments, and proper formatting intact. How Sourcemaps Work When you build your application with tools like Webpack, Vite, or Rollup, they can generate sourcemap files alongside your production bundles. A minified file references its sourcemap using a special comment at the end: ` The sourcemap file itself contains a JSON structure with several key fields: ` The mappings field uses an encoding format called VLQ (Variable Length Quantity) to map each position in the minified code back to its original location. The browser's DevTools use this information to show you the original code while you're debugging. Types of Sourcemaps Build tools support several variations of sourcemaps, each with different trade-offs: Inline sourcemaps: The entire mapping is embedded directly in your JavaScript file as a base64 encoded data URL. This increases file size significantly but simplifies deployment during development. ` External sourcemaps: A separate .map file that's referenced by the JavaScript bundle. This is the most common approach, as it keeps your production bundles lean since sourcemaps are only downloaded when DevTools is open. Hidden sourcemaps: External sourcemap files without any reference in the JavaScript bundle. These are useful when you want sourcemaps available for error tracking services like Sentry, but don't want to expose them to end users. Why Sourcemaps During development, sourcemaps are absolutely critical. They will help avoid having to guess where errors occur, making debugging much easier. Most modern build tools enable sourcemaps by default in development mode. Sourcemaps in Production Should you ship sourcemaps to production? It depends. While security by making your code more difficult to read is not real security, there's a legitimate argument that exposing your source code makes it easier for attackers to understand your application's internals. Sourcemaps can reveal internal API endpoints and routing logic, business logic, and algorithmic implementations, code comments that might contain developer notes or TODO items. Anyone with basic developer tools can reconstruct your entire codebase when sourcemaps are publicly accessible. While the Apple leak contained no credentials or secrets, it did expose their component architecture and implementation patterns. Additionally, code comments can inadvertently contain internal URLs, developer names, or company-specific information that could potentially be exploited by attackers. But that’s not all of it. On the other hand, services like Sentry can provide much more actionable error reports when they have access to sourcemaps. So you can understand exactly where errors happened. If a customer reports an issue, being able to see the actual error with proper context makes diagnosis significantly faster. If your security depends on keeping your frontend code secret, you have bigger problems. Any determined attacker can reverse engineer minified JavaScript. It just takes more time. Sourcemaps are only downloaded when DevTools is open, so shipping them to production doesn't affect load times or performance for end users. How to manage sourcemaps in production You don't have to choose between no sourcemaps and publicly accessible ones. For example, you can restrict access to sourcemaps with server configuration. You can make .map accessible from specific IP addresses. Additionally, tools like Sentry allow you to upload sourcemaps during your build process without making them publicly accessible. Then configure your build to generate sourcemaps without the reference comment, or use hidden sourcemaps. Sentry gets the mapping information it needs, but end users can't access the files. Learning from Apple's Incident Apple's sourcemap incident is a valuable reminder that even the largest tech companies can make deployment oversights. But it also highlights something important: the presence of sourcemaps wasn't actually a security vulnerability. This can be achieved by following good security practices. Never include sensitive data in client code. Developers got an interesting look at how Apple structures its Svelte codebase. The lesson is that you must be intentional about your deployment configuration. If you're going to include sourcemaps in production, make that decision deliberately after considering the trade-offs. And if you decide against using public sourcemaps, verify that your build process actually removes them. In this case, the public repo was quickly removed after Apple filed a DMCA takedown. (https://github.com/github/dmca/blob/master/2025/11/2025-11-05-apple.md) Making the Right Choice So what should you do with sourcemaps in your projects? For development: Always enable them. Use fast options, such as eval-source-map in Webpack or the default configuration in Vite. The debugging benefits far outweigh any downsides. For production: Consider your specific situation. But most importantly, make sure your sourcemaps don't accidentally expose secrets. Review your build output, check for hardcoded credentials, and ensure sensitive configurations stay on the backend where they belong. Conclusion Sourcemaps are powerful development tools that bridge the gap between the optimized code your users download and the readable code you write. They're essential for debugging and make error tracking more effective. The question of whether to include them in production doesn't have a unique answer. Whatever you decide, make it a deliberate choice. Review your build configuration. Verify that sourcemaps are handled the way you expect. And remember that proper frontend security doesn't come from hiding your code. Useful Resources * Source map specification - https://tc39.es/ecma426/ * What are sourcemaps - https://web.dev/articles/source-maps * VLQ implementation - https://github.com/Rich-Harris/vlq * Sentry sourcemaps - https://docs.sentry.io/platforms/javascript/sourcemaps/ * Apple DMCA takedown - https://github.com/github/dmca/blob/master/2025/11/2025-11-05-apple.md...

Let's innovate together!

We're ready to be your trusted technical partners in your digital innovation journey.

Whether it's modernization or custom software solutions, our team of experts can guide you through best practices and how to build scalable, performant software that lasts.

Prefer email? hi@thisdot.co