Build IT Better DevOps - Monitoring Roundup
On This Dot's Build IT Better show, I talk to people who make popular tools that help developers make great software. In my most recent series, we looked at application monitoring tools. Marcus Olssen from Grafana and Ben Vinegar from Sentry showed us how the tools they work on can help developers keep their applications running smoothly.
Grafana
Grafana is an organization that builds a number of open source observation and monitoring tools for collecting and visualizing application metrics. Their namesake product is a platform for aggregating and visualizing any kind of data from a near limitless number of sources via their rich plugin library. Grafana's commercial counterpart, Grafana Labs, maintains this plugin library as well as educational resources for the Grafana ecosystem and paid products and services for companies that are looking for help managing their own Grafana tooling.
Flexibility
Grafana is a platform for application monitoring and analytics that offers a really huge amount of flexibility for collecting and analyzing application data. Instead of providing a hyper-focused application monitoring solution, Grafana provides unparallelled flexibility for collecting almost any kind of data. Grafana offers built in integrations for all the most popular SQL and non-SQL databases, as well as Grafana's own popular application monitoring tools, Prometheus, Loki, and Tempo (and a handful of other popular sources). Community developed plugins can be used to add support for most other platforms. This flexibility allows Grafana to have applications outside the traditional application monitoring use cases. Some are even using Grafana to track their own home energy usage and health data. You can really analyze almost any kind of data in Grafana.

*A Grafana dashboard with custom metrics*
Datasource Compatibility
While flexibility allows Grafana to reach across industries to find users and use cases, it still excels at traditional application monitoring. Developers can use Prometheus to pull data out of their own applications. Most popular host operating systems and appliation development frameworks offer community developed integrations with Prometheus that will provide useful system and application data like resource usage and response time, as well as the ability to publish your own custom application data. Loki is a tool for aggregating and querying system and application logs. Also, you can use Tempo for aggregating distributed application trace data from tools like Jaeger, OpenTelemetry, and Zipkin. If you use all 4 tools together, you can visually trace transactions all the way through your application, even as the user shifts between different components of your microservice architecture.
Visualization and Analysis
All of this flexible data collection technology would be useless without Grafana's equally flexible visualization platform. Once you've integrated all your data sources, you can use Grafana to explore and visualize data you've collected. You can use dashboards to create an array of vizualizations of your data. As a DevOps engineer, one of my favorite things about Grafana is their Dashboard library. The dashboard library contains community developed dashboards for a number of popular (and not so popular) application frameworks and backend tools and systems. Instead of needing to make your own dashboards from scratch for monitoring Rails apps and PostgreSQL databases, you can simply add and modify community Dashboards, saving you time and providing insights you may not have considered on your own. Finally, we have to mention the Explore tool. It can be easy to overlook with everything that's possible with Dashboards, but it allows users to easily view, query, and analyze data streams on the fly without needing to create permanent dashboards.
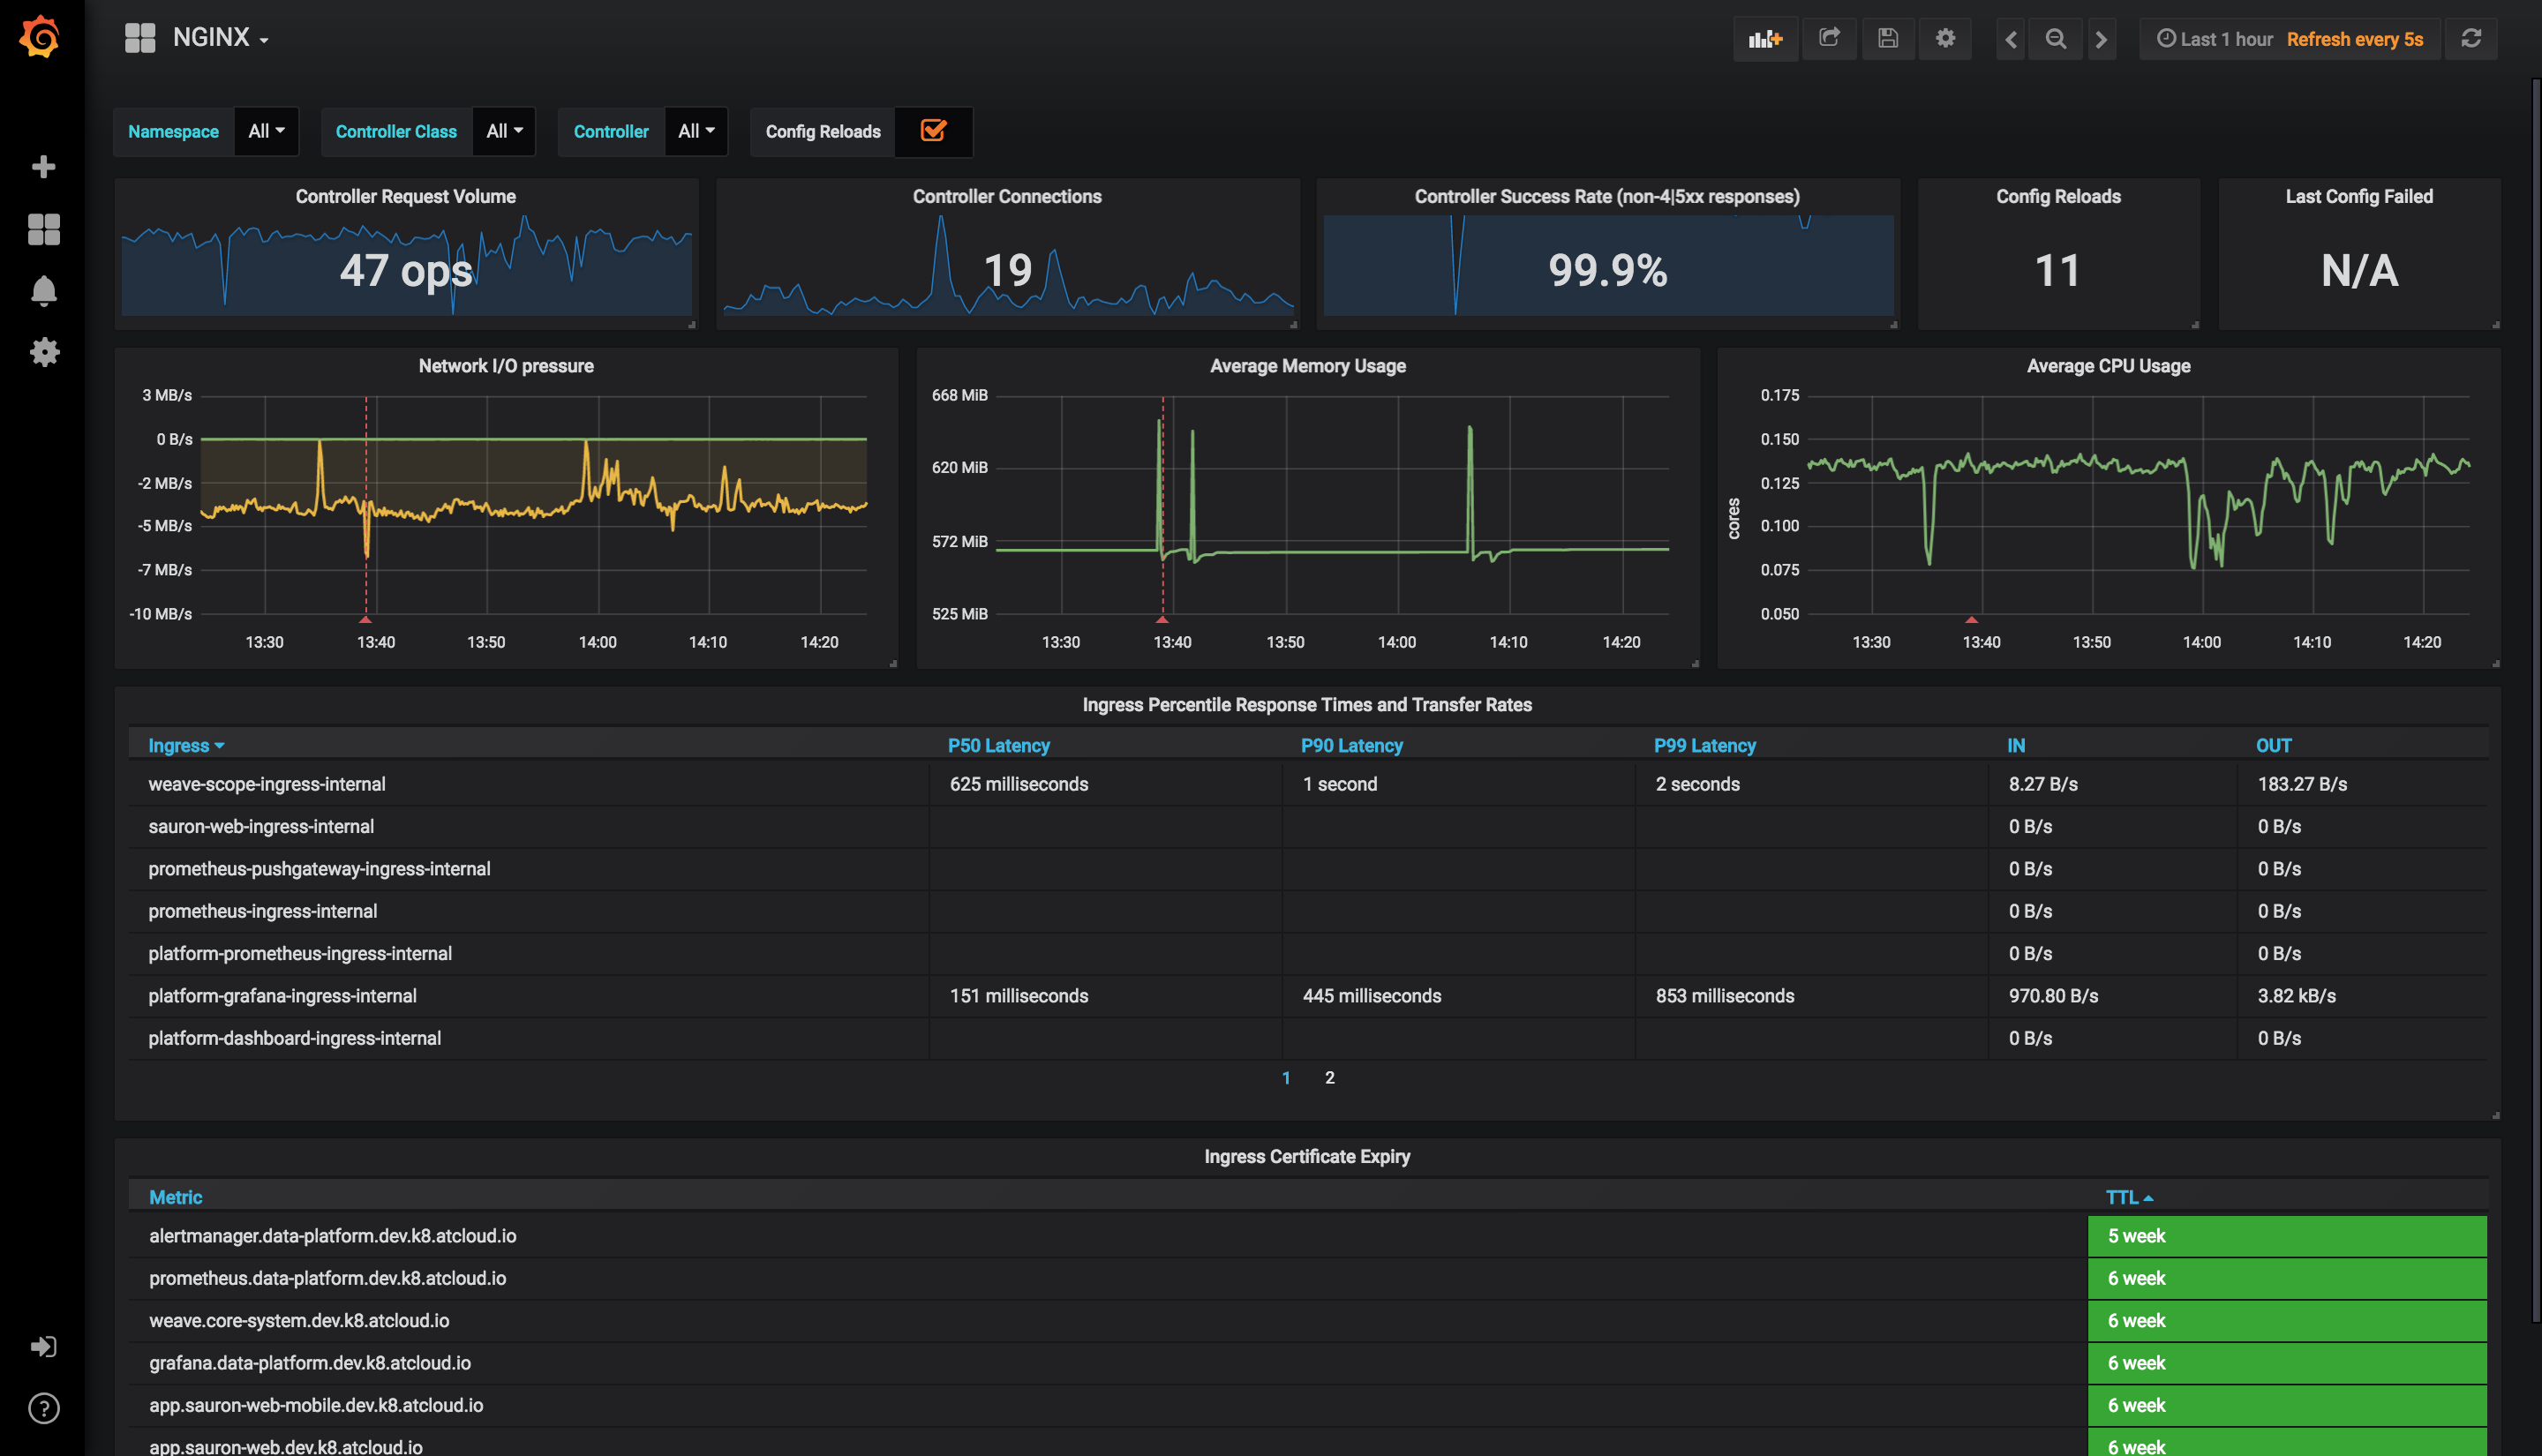
*Grafana Nginx Dashboard - available from the dashboard library*
This big tent collection of features makes Grafana a great platform for observing any amount of any kind data. The flexibility does come with the overhead of needing to know a lot about a number of different tools like Prometheus and Loki, which have a non-trivial amount of overhead on their own. As with any community-developed content, plugins and dashboards from the library don't always work as expected out of the box and will often need to be modified to line up with your devops procedures and environments.
Sentry
Sentry, like Grafana, is a tool for monitoring application health and performance. However, unlike Grafana, Sentry is laser-focused on providing curated experiences with deep first party integrations for popular application development tools and provides some additional tools for tracking user errors and code changes, which it uses as the framing narrative for all of the data the Sentry platform surfaces for developers. Integratons are available for most popular frontend JavaScript frameworks (React, Angular, Vue, etc) and backend applications in Python, Ruby, Go, and more. Sentry gives developers a huge amount of visibility without the overhead of more complex devops driven platforms like Grafana.
Developer Focused
Sentry's primary goal is to help you understand what's wrong with all of the parts of your application. They do this by giving you a view into what errors your users are experiencing in real time. Sentry collects data on all of the exceptions thrown by applications which have a Sentry integration. As you investigate individual issues, Sentry provides you with a curated collection of datapoints to cross reference with the specific error. Sentry provides some very traditional data, such as user like browser agent, OS, their geographical location, and the url they were visiting, but it also connects that error back to the code. Not only can you see the stack trace and easily see the lines of code where the error manifested, but Sentry also uses its deep integration to provide what they call "Breadcrumbs." These are pieces of data about what actual activity led up to the error. Depending on the what type of application you're troubleshooting, this might be things like log output, events fired from UI elements, or your own custom breadcrumb events. These can give you a better idea of the actions the user took leading up to the error.

*Sentry's Issue (aka Error) View*

*A sample of Sentry's Breadcrumbs*
Integrations
In addition to helping you identify the root cause of your errors, Sentry also aggregates errors to make it easier for you to understand which errors have the highest impact on your application. You can easily identify errors that are happening frequently and on critical paths. If you've enabled integration with a source control platform like GitHub, Sentry will even make suggestions as to which code commits introduced the problem. All these features together will help you tackle application health like a devops expert, without needing to be a devops expert.
Application Performance
Debugging and error surfacing aren't the only place where Sentry shines. I'm really excited to talk about Sentry's performance and application tracing platform. Using their deep framework and platform integrations, you're able to collect a lot of performance data from your applicaitons and to coallate them with user behaviors. Similar to the debugging experience, Sentry starts you from a broad view of your performance picture, and shows you the slowest pages and endpoints of your application, and provides you with another curated experince for investigating and resolving performance problems. The most interesting aspect of the performance investigation tools are transactions, or traces. When you choose a slow page to begin investigating, alongside the individual performance metrics for that page, are transactions. These transactions allow you to see the performance of your pages broken into waterfall graphs, like you might already be used to from browser dev tools. However, Sentry adds some really cool tricks since they're deeply integrated into all the parts of your application. If you analyze a transaction that starts from your javascript app and see that there's a fetch request that's taking a long time, assuming the API is part of your stack that's integrated with Sentry, you can click down into that fetch request within the Sentry UI and switch contexts to the API application and see a waterfall graph of what the API did to handle that request, allowing you to simply traverse your whole application to identify the exact source of performance problems. These transactions also benefit from the same Breadcrumb and code change data that's provided in the error analysis tools.
Conclusions
Sentry and Grafana are both strong tools to add to your DevOps toolbelt. While they both provide great features for observing application health and analyzing data, they really fill two pretty different niches. Sentry provides curated developer experiences and deep integrations that will help developers dive head first into error and performance monitoring for their applications without needing to be experts. However for experts and "data scientists" Grafana provides an incredibly powerful and flexible platform for not only analyzing application metrics and health, but really any data you can manage to get into a Dashboard. Some organizations may even benefit from using both tools for different use cases.
About the author