When it comes to performance, developers often use Lighthouse, Perfbuddy, or similar performance analysis tools. But when the target site has protection against bots, getting information is not that simple. In this blog post, we are going to focus on where to look for signs of performance bottlenecks by using Chrome Devtools.
Preparations
Even when access to automated performance analysis tools is restricted, the Network, Performance, and Performance Insights tabs of Chrome Devtools can still be leveraged. To do that, some preparations can be made.
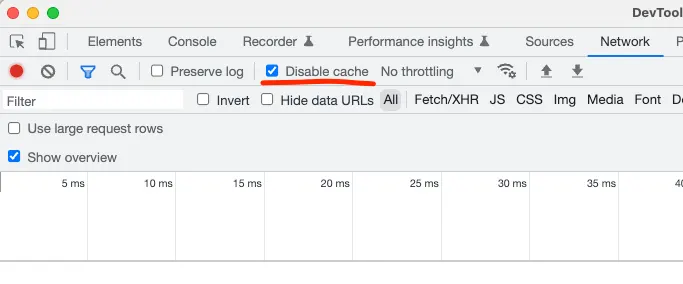
When starting our analysis, I recommend opening the page we want to analyse in incognito mode. So we separate the analysis from our regular browser habits, cookies, and possible browser extensions. When we load the page for the first time, let's make sure we disable caching in the Network tab, so resources are always fetched when we reload.
Some pages heavily rely on client-side storage mechanisms such as indexedDB, localStorage, and sessionStorage. Cookies can also interfere. Therefore, it's good to leverage the "Application" tab's Clear site data button to make sure lingering data won't interfere with your results.
Some antivirus software with network traffic filtering can also interfere with your requests. They can block, slow down, or even intercept and modify certain network requests, which can greatly affect loading time and the accuracy of your results. If the site under analysis is safe, we recommend disabling network traffic filtering temporarily.
We strongly suggest just looking at the page and reloading it a few times to get a feeling of its performance. A lot of things cannot be detected by human eyes, but you can look for flickers and content shifts on the page. These performance issues can be good entry points to your investigation.
Common bottlenecks: resources
Let's start at the Network tab, where we can identify if resources are not optimised. After we reload the page, we can use the filters on the network tab to focus on image resources. Then we can see the information of these requests, including the size of the images, the time it took to load each image, and any errors that occurred. The waterfall chart is also useful. This is where you can see the timing of each image resource loading.
We should look for evidence that the image resources are served from a CDN, with proper compression. We can check the resources one by one, and see if they contain Content-Encoding: gzip or Content-Encoding: br headers. If these headers are missing, we found one bottleneck that can be fixed by serving images using gzip or brotli compression while serving them.
Headers on resource requests can tell other signs of errors. It can also happen that images are served from a CDN, such as fastly, but if there are fastly-io-error headers on the resources, it can mean that something is misconfigured.
We also need to check the dimensions of the images. If an image is larger than the space it's being displayed in, it may be unnecessarily slowing down the page. If we find such bottlenecks, we can resize the images to match the actual dimensions of the space where they are being displayed to improve loading time.
Server-side rendering can improve your SEO altogether, but it is worth checking the size of the index.html file because sometimes it can be counterproductive. It is recommended to try and keep HTML files under 100kb to keep the TTFB (Time To First Byte) metric under 1 second.
If the page uses polyfills, it's worth checking what polyfills are in use. IE11 is no longer supported, and loading unnecessary polyfills for that browser slows down the page load time.
Performance Insights Tab
The performance Insights Tab in Chrome DevTools allows users to measure the page load of a website. This is done by running a performance analysis on the website and providing metrics on various aspects of the page load process, such as the time it takes for the page to be displayed, the time it takes for network resources to be loaded, and the time it takes for the page to be interactive.
The performance analysis is run by simulating a user visiting the website and interacting with it, which allows the tool to accurately measure the performance of the page under real-world conditions. This information can then be used to identify areas of the website that may be causing slowdowns and to optimize the performance of the page.
Follow the steps to run an analysis:
- Open the Chrome Devtools
- Select the "Performance insights" tab
- Click on the Measure page load button
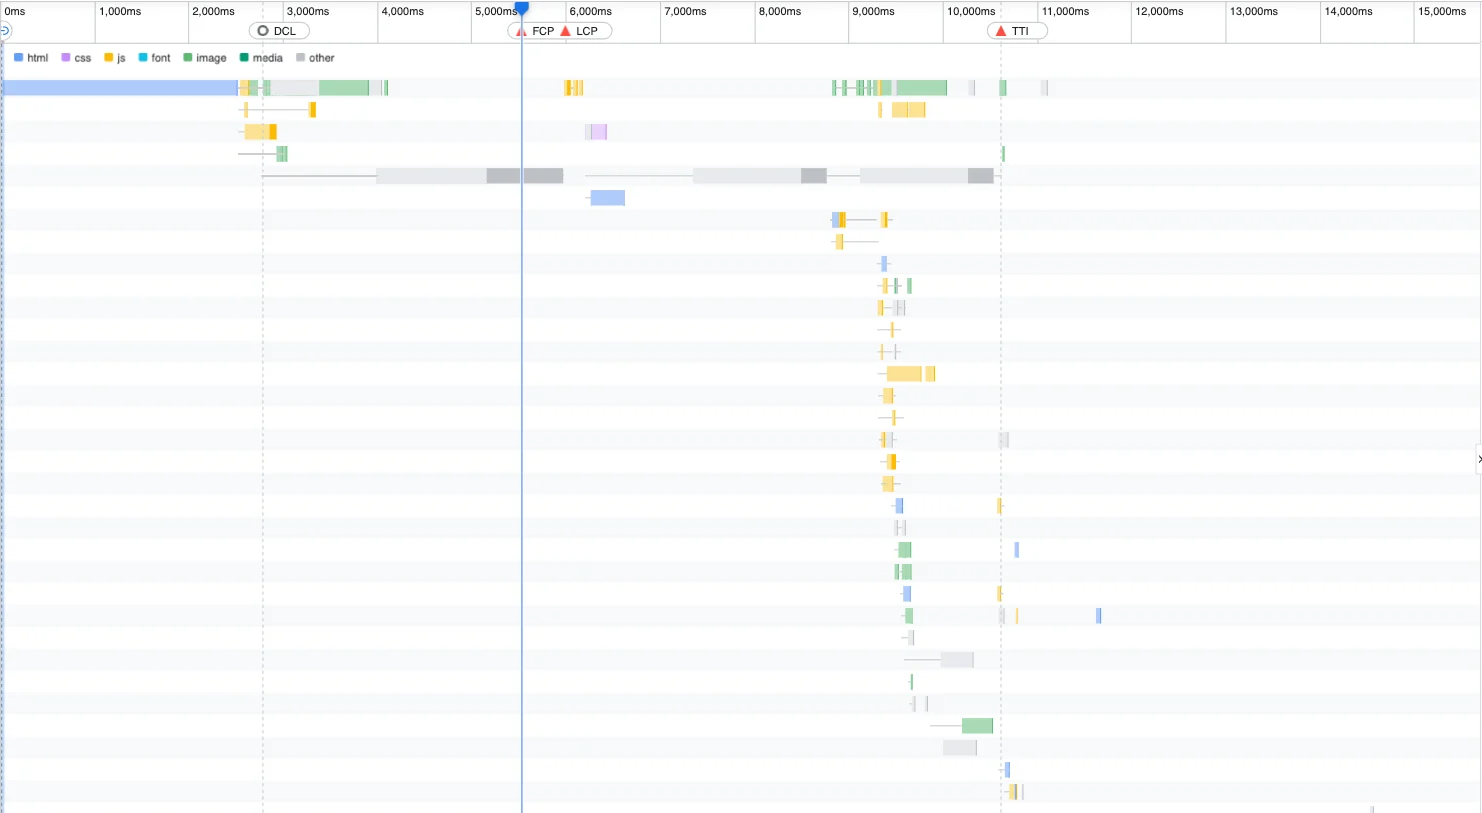
The analysis provides us with a detailed waterfall representation of requests, color coded to the request types. It can help you identify requests that block/slow down the page rendering, and/or expensive function calls that block the main thread. It also provides you with information on important performance metrics, such as DCL (DOM Content Loaded), FCP (First Contentful Paint), LCP (Largest Contentful Paint) and TTI (Time To Interactive). You can also simulate network or CPU throttling, or enable the cache if your use case requires that.
DCL refers to the time it takes for the initial HTML document to be parsed and for the DOM to be constructed. FCP refers to the time it takes for the page to display the first contentful element, such as an image or text. LCP is a metric that measures the loading speed of the largest element on a webpage, such as an image or a block of text. A fast LCP helps ensure that users see the page's main content as soon as possible, which can improve the overall user experience. TTI refers to the time it takes for the page to become fully interactive, meaning that all of the necessary resources have been loaded and the page is responsive to user input.
Performance Tab
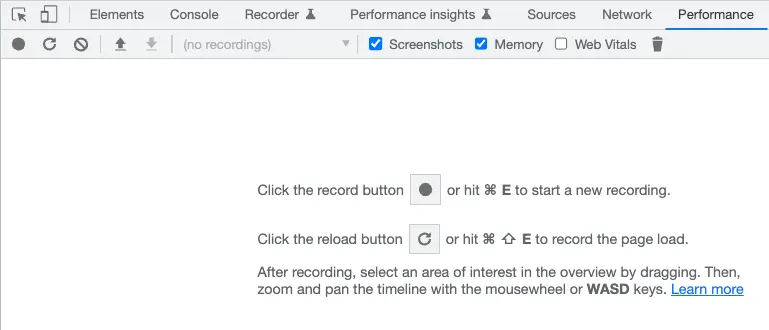
The "start profiling and reload page" button in the Performance tab of Chrome DevTools allows users to run a performance analysis on a website and view detailed information about how the page is loading and rendering. By clicking this button, the tool will simulate a user visiting the website and interacting with it, and will then provide metrics and other information about the page load process.
Follow the steps to run an analysis
- Open the Chrome Devtools
- Select the "Performance" tab
- Click on the button with the "refresh" icon
A very useful part of this view is the detailed information provided on the main thread. We can interact with call stacks and find functions that might run too long, blocking the main thread, and delaying the TTI (Time To Interactive) metric. Selecting a function gives all kinds of information on that function. You can see how long that function was running, and what other functions it called, and you can also directly open that function in the Sources tab.
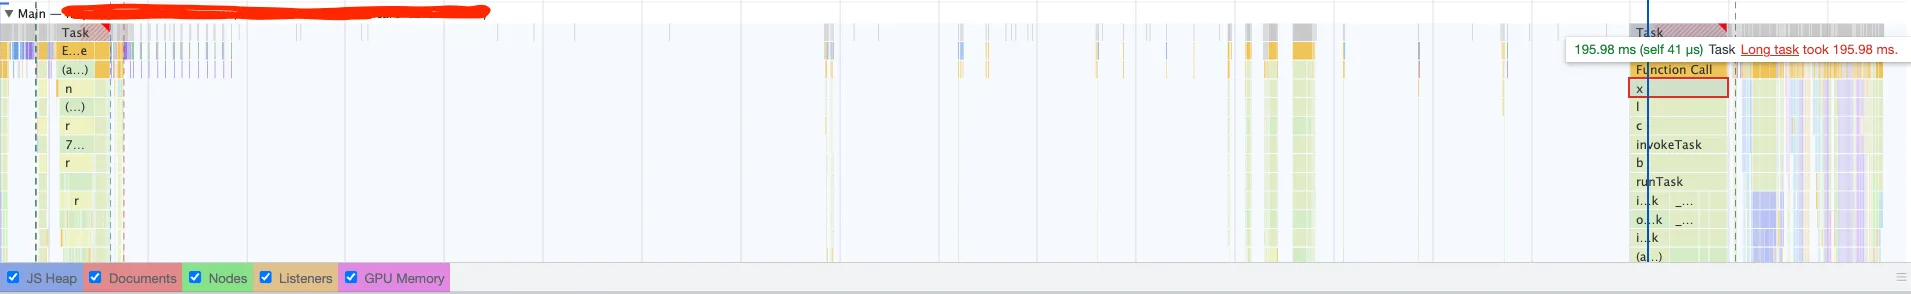
Identifying long-running, blocking functions is crucial in finding performance bottlenecks. One way to mitigate them is to move them into worker threads.
Chrome DevTools is a powerful tool for analyzing the performance of web applications. By using the network tab, you can identify issues with resources that might slow down page load. With the Performance insights and Performance tabs, we can identify issues that may be causing the website to load slowly, and take steps to optimize the code for better performance. Whether you're a beginner or an experienced developer, Chrome DevTools is an essential tool for analyzing and improving the performance of web applications.